#EURJPY @ 159.430 The is seen at 159.40 with 0.30% losses. (Pivot Orderbook analysis)
…
This is a premium post.
[s2If !current_user_can(access_s2member_level4)]Please register for FREE REGISTER to read full post below containing analysis. In case of any error or you think you are not able to read the full post below, please email us at support#nehcap.com [lwa][/s2If] [s2If current_user_can(access_s2member_level1)]
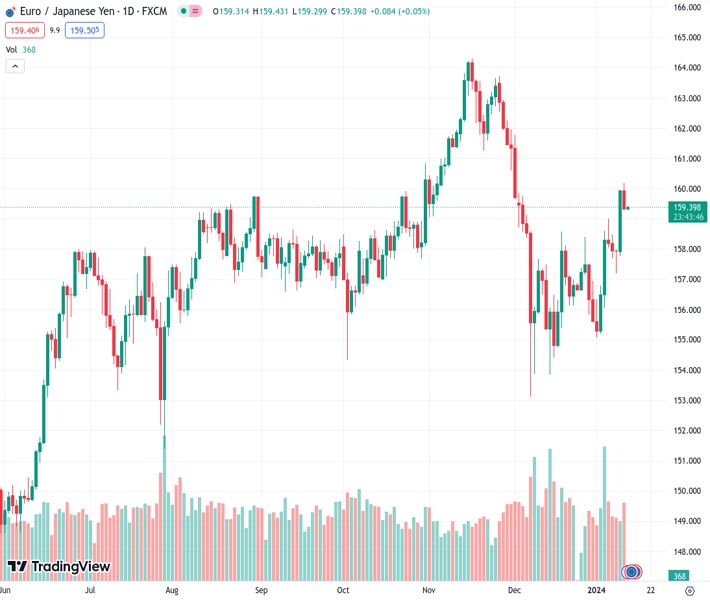
- The EUR/JPY is seen at 159.40 with 0.30% losses.
- The cross rallied 1.30% on Wednesday, towards 160.00, it highest since the beginning of December..
- Daily chart indicators reveal a stagnant yet optimistic RSI and a leveled-off MACD histogram, hinting at a steady buying momentum.
- Charts suggest bullish control overall despite consolidation in four-hour chart indicators.
The pair currently trades last at 159.430.
The previous day high was 159.89 while the previous day low was 157.61. The daily 38.2% Fib levels comes at 159.02, expected to provide support. Similarly, the daily 61.8% fib level is at 158.48, expected to provide support.
In Thursday’s session, the EUR/JPY declined slightly. A bullish outlook dominates the daily charts, showing signs of bulls gaining ground. Simultaneously, the four-hour chart indicators are hinting at a consolidation phase, stepping back from overbought conditions.
Analyzing the daily chart, the indicators shed light on a relatively stable scenario with a positive undertone. The flat projection of the Relative Strength Index (RSI) that it’s ensconced in positive territory, along with the steady green bars of the Moving Average Convergence Divergence (MACD), essentially underpins a scenario that is favorable for buyers as it seems to be consolidating Wednesday’s 1.30% rally. Further contributing to the buying momentum, the pair’s placement well above the 20, 100, and 200-day Simple Moving Averages (SMAs) accentuates the command of the bulls in the grand scheme of things despite a short-term pullback.
On the four-hour chart, an amalgamation of consolidating indicators and overbought conditions suggests that a correction may be incoming for the immediate short-term. The four-hour Relative Strength Index (RSI) follows a downtrend but remains positive, while the Moving Average Convergence Divergence (MACD) sustains its green bars, albeit flat. Such an array of factors depicts a temporary deceleration of the buying momentum, but the outlook is still skewed towards bullishness in the near term, given the current technical setting.
Technical Levels: Supports and Resistances
EURJPY currently trading at 159.45 at the time of writing. Pair opened at 159.88 and is trading with a change of -0.27 % .
| Overview | Overview.1 | |
|---|---|---|
| 0 | Today last price | 159.45 |
| 1 | Today Daily Change | -0.43 |
| 2 | Today Daily Change % | -0.27 |
| 3 | Today daily open | 159.88 |
The pair remains strongly bullish on the daily timeframe. It trades above its 20 SMA @ 156.95, 50 SMA 159.25, 100 SMA @ 158.63 and 200 SMA @ 155.6.
| Trends | Trends.1 | |
|---|---|---|
| 0 | Daily SMA20 | 156.95 |
| 1 | Daily SMA50 | 159.25 |
| 2 | Daily SMA100 | 158.63 |
| 3 | Daily SMA200 | 155.60 |
The previous day high was 159.89 while the previous day low was 157.61. The daily 38.2% Fib levels comes at 159.02, expected to provide support. Similarly, the daily 61.8% fib level is at 158.48, expected to provide support.
Note the levels of interest below:
- Pivot support is noted at 158.36, 156.84, 156.08
- Pivot resistance is noted at 160.65, 161.41, 162.93
| Levels | Levels.1 |
|---|---|
| Previous Daily High | 159.89 |
| Previous Daily Low | 157.61 |
| Previous Weekly High | 159.00 |
| Previous Weekly Low | 155.07 |
| Previous Monthly High | 161.78 |
| Previous Monthly Low | 153.17 |
| Daily Fibonacci 38.2% | 159.02 |
| Daily Fibonacci 61.8% | 158.48 |
| Daily Pivot Point S1 | 158.36 |
| Daily Pivot Point S2 | 156.84 |
| Daily Pivot Point S3 | 156.08 |
| Daily Pivot Point R1 | 160.65 |
| Daily Pivot Point R2 | 161.41 |
| Daily Pivot Point R3 | 162.93 |
[/s2If]
Nehcap Trading Strategies
The NEHCAP currently runs the following trading systems for clients. They can be bought and run on your funds.
The system is trading live: LIVE ACCOUNT TRACKING
Contact Us: Contact
The HFT_FIX can be run free for 2 weeks on any broker with a ECN. Apply for a free trial
Join Our Telegram Group
")


