For consecutive days, the AUDUSD pair has been trading above the mid-0.6400s, indicating a positive trend.
…
This is a premium post.
[s2If !current_user_can(access_s2member_level4)]Please register for FREE REGISTER to read full post below containing analysis. In case of any error or you think you are not able to read the full post below, please email us at support#nehcap.com [lwa][/s2If] [s2If current_user_can(access_s2member_level1)]
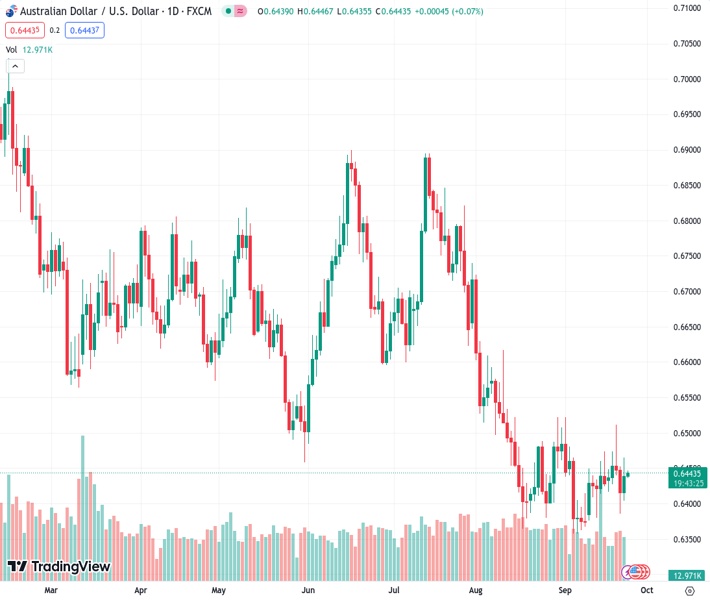
- AUD/USD trades in positive territory for two straight days below the mid-0.6400s.
The pair currently trades last at 0.64418.
The previous day high was 0.6465 while the previous day low was 0.6404. The daily 38.2% Fib levels comes at 0.6442, expected to provide resistance. Similarly, the daily 61.8% fib level is at 0.6427, expected to provide support.
The AUD/USD pair gains traction during the early Asian session on Monday. The rebound of the pair is bolstered by the weakness of the US Dollar (USD) and a decline in US Treasury bond yields. At the press time, AUD/USD is trading at 0.6442, up 0.03% for the day.
Australian PMI data showed a slight improvement on Friday. The preliminary S&P Global Services PMI posted 50.5 in September, improved from 47.8 in August. While the Manufacturing PMI dropped to 48.2 from 49.6 in the previous reading. The Composite Index was also improved from 48.0 to 50.2.
The release of the Reserve Bank of Australia’s (RBA) Minutes on the September monetary policy meeting revealed that additional tightening may be necessary if inflation proves more persistent than anticipated. But the case for maintaining the status quo was stronger, and recent data have not materially altered the economic outlook. This, in turn, might cap the upside of the Aussie and act as a headwind for the AUD/USD pair.
On the USD’s front, the Federal Reserve (Fed) decided to hold the interest rate unchanged in the 5.25% to 5.50% range at its September meeting. In terms of macroeconomic predictions, most members still expect further rate rises later this year. Susan Collins and Mary Daly, presidents of the Federal Reserve Banks of Boston and San Francisco, emphasized that although inflation is cooling down, additional rate hikes would be necessary.
Additionally, Minneapolis Federal Reserve President Neel Kashkari said he would have thought with 500 basis points (bps) or 525 bps of interest rate increases as they would have slammed the brakes on consumer spending and it has not slammed the brakes on consumer spending.
About the data, the US S&P Global Manufacturing PMI improved to 48.9 in September from 47.9 in August, indicating an ongoing contraction in the manufacturing sector’s business activity. Meanwhile, the Services PMI fell to 50.2 from 50.5 in the previous month. Finally, the Composite PMI dropped to 50.1, down marginally from 50.2 in August.
Later this week, the Australian Monthly Consumer Price Index for August will be due on Wednesday ahead of the Retail Sales on Thursday. The highlight of the week will be the release of the US Core Personal Consumption Expenditure (PCE) Price Index, the Fed’s preferred measure of consumer inflation. The annual figure is expected to drop from 4.2% to 3.9%. Traders will take cues from these figures and find trading opportunities around the AUD/USD pair.
Technical Levels: Supports and Resistances
AUDUSD currently trading at 0.6444 at the time of writing. Pair opened at 0.6441 and is trading with a change of 0.05 % .
| Overview | Overview.1 | |
|---|---|---|
| 0 | Today last price | 0.6444 |
| 1 | Today Daily Change | 0.0003 |
| 2 | Today Daily Change % | 0.0500 |
| 3 | Today daily open | 0.6441 |
The pair is trading above its 20 Daily moving average @ 0.6432, below its 50 Daily moving average @ 0.6523 , below its 100 Daily moving average @ 0.6605 and below its 200 Daily moving average @ 0.6697
| Trends | Trends.1 | |
|---|---|---|
| 0 | Daily SMA20 | 0.6432 |
| 1 | Daily SMA50 | 0.6523 |
| 2 | Daily SMA100 | 0.6605 |
| 3 | Daily SMA200 | 0.6697 |
The previous day high was 0.6465 while the previous day low was 0.6404. The daily 38.2% Fib levels comes at 0.6442, expected to provide resistance. Similarly, the daily 61.8% fib level is at 0.6427, expected to provide support.
Note the levels of interest below:
- Pivot support is noted at 0.6408, 0.6375, 0.6347
- Pivot resistance is noted at 0.647, 0.6498, 0.6531
| Levels | Levels.1 |
|---|---|
| Previous Daily High | 0.6465 |
| Previous Daily Low | 0.6404 |
| Previous Weekly High | 0.6511 |
| Previous Weekly Low | 0.6385 |
| Previous Monthly High | 0.6724 |
| Previous Monthly Low | 0.6364 |
| Daily Fibonacci 38.2% | 0.6442 |
| Daily Fibonacci 61.8% | 0.6427 |
| Daily Pivot Point S1 | 0.6408 |
| Daily Pivot Point S2 | 0.6375 |
| Daily Pivot Point S3 | 0.6347 |
| Daily Pivot Point R1 | 0.6470 |
| Daily Pivot Point R2 | 0.6498 |
| Daily Pivot Point R3 | 0.6531 |
[/s2If]
Download Nehcap EAWe have two EAs that are operational on our LIVE accounts.
- EA-FIX: Check out the details here. Download EA-FIX . EA-FIX is a non-grid HFT scalper.
- EA-GROWTH: High quality low dd EA using trend grids. Download EA_GROWTHJoin Our Telegram Group
")


