The NZD to USD exchange rate is currently at 0.5917, which is an increase of 0.37%. This gain has occurred due to a decrease in US Treasury bond yields, which is benefiting the New Zealand dollar.
…
This is a premium post.
[s2If !current_user_can(access_s2member_level4)]Please register for FREE REGISTER to read full post below containing analysis. In case of any error or you think you are not able to read the full post below, please email us at support#nehcap.com [lwa][/s2If] [s2If current_user_can(access_s2member_level1)]
- NZD/USD trades at 0.5917, up 0.37%, as US Treasury bond yields retreat, providing a tailwind for the Kiwi currency.
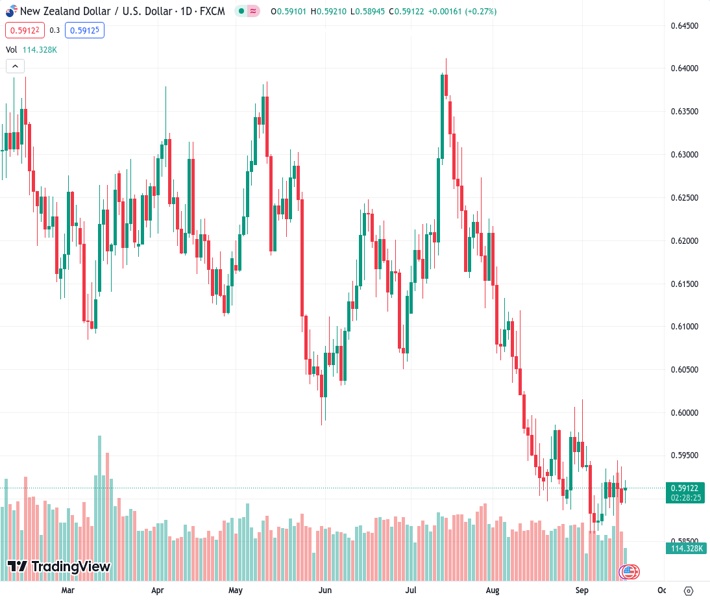
The pair currently trades last at 0.59120.
The previous day high was 0.5938 while the previous day low was 0.5892. The daily 38.2% Fib levels comes at 0.591, expected to provide support. Similarly, the daily 61.8% fib level is at 0.592, expected to provide resistance.
The New Zealand Dollar (NZD) trims some of its losses vs. the American Dollar (USD) and prints solid gains of 0.37% as US Treasury bond yields retrace from last week’s high, ahead of the following US Federal Reserve’s monetary policy decision. Hence, the NZD/USD is trading at 0.5917 after hitting a daily low of 0.5895.
Market sentiment is upbeat ahead of the Fed’s decision, bolstering the Kiwi, though it remains near the day’s lows. Improvement on last week’s Chinese data sponsored a slim recovery on the NZD/USD pair amid an absent US economic docket on Monday.
Jerome Powell and Co. are expected to keep rates unchanged while updating their monetary policy path, as he and his colleagues would actualize the ‘dot-plot.’ Additionally, Fed officials would update their economic forecasts, included in the Summary of Economic Projections (SEP).
Should be said the latest US economic data showed inflation ticked up, retail sales hold the fort, growing at solid levels, while the labor market remains tight. Even though consumer sentiment deteriorated, they remain optimistic that prices would edge lower, as shown by the University of Michigan (UoM) Consumer Sentiment report.
Nevertheless, as US economic activity continues to slow down at a moderate pace, market participants have begun to price in a possible soft landing. In the meantime, the US Dollar Index, which tracks the Greenback’s performance against a basket of six currencies, dropped 0.17%, down at 105.15, a tailwind for the NZD/USD. Falling US Treasury bond yields are to be blamed, as the 10-year note coupon falls 0.39%, at 4.317%.
Aside from this, the New Zealand (NZ) economic docket during the current week could delineate the NZD’s direction. The release of the Current Account, the Westpac Consumer Survey, the Gross Domestic Product (GDP), and the Trade Balance would give us some clues regarding the status of NZ’s economy.
Last week, the NZD/USD remained in sideways trading, unable to break to new year-to-date (YTD) lows of 0.589, but unable to reclaim the 0.6000 figure. Nevertheless, the pair is still downward biased as the 50 and 200-day Moving Averages (DMAs) slopes aim downwards. That and price action remaining below the September 1 daily high at 0.6015 could pave the way for further upside and test the 50-DMA at 0.6047. On the downside, the 0.5900 threshold is the first support, followed by the YTD low.
Technical Levels: Supports and Resistances
NZDUSD currently trading at 0.5914 at the time of writing. Pair opened at 0.5898 and is trading with a change of 0.27 % .
| Overview | Overview.1 | |
|---|---|---|
| 0 | Today last price | 0.5914 |
| 1 | Today Daily Change | 0.0016 |
| 2 | Today Daily Change % | 0.2700 |
| 3 | Today daily open | 0.5898 |
The pair remains strongly bearish on the daily time frame. It trades below the 20 SMA @ 0.5922, 50 SMA 0.6054, 100 SMA @ 0.6111 and 200 SMA @ 0.6199.
| Trends | Trends.1 | |
|---|---|---|
| 0 | Daily SMA20 | 0.5922 |
| 1 | Daily SMA50 | 0.6054 |
| 2 | Daily SMA100 | 0.6111 |
| 3 | Daily SMA200 | 0.6199 |
The previous day high was 0.5938 while the previous day low was 0.5892. The daily 38.2% Fib levels comes at 0.591, expected to provide support. Similarly, the daily 61.8% fib level is at 0.592, expected to provide resistance.
Note the levels of interest below:
- Pivot support is noted at 0.5881, 0.5863, 0.5835
- Pivot resistance is noted at 0.5927, 0.5955, 0.5973
| Levels | Levels.1 |
|---|---|
| Previous Daily High | 0.5938 |
| Previous Daily Low | 0.5892 |
| Previous Weekly High | 0.5945 |
| Previous Weekly Low | 0.5880 |
| Previous Monthly High | 0.6219 |
| Previous Monthly Low | 0.5885 |
| Daily Fibonacci 38.2% | 0.5910 |
| Daily Fibonacci 61.8% | 0.5920 |
| Daily Pivot Point S1 | 0.5881 |
| Daily Pivot Point S2 | 0.5863 |
| Daily Pivot Point S3 | 0.5835 |
| Daily Pivot Point R1 | 0.5927 |
| Daily Pivot Point R2 | 0.5955 |
| Daily Pivot Point R3 | 0.5973 |
[/s2If]
Download Nehcap EAWe have two EAs that are operational on our LIVE accounts.
- EA-FIX: Check out the details here. Download EA-FIX . EA-FIX is a non-grid HFT scalper.
- EA-GROWTH: High quality low dd EA using trend grids. Download EA_GROWTHJoin Our Telegram Group
")


