Silver is currently stabilizing at its lowest point since July 7th after experiencing a decline in value.
…
This is a premium post.
[s2If !current_user_can(access_s2member_level4)]Please register for FREE REGISTER to read full post below containing analysis. In case of any error or you think you are not able to read the full post below, please email us at support#nehcap.com [lwa][/s2If] [s2If current_user_can(access_s2member_level1)]
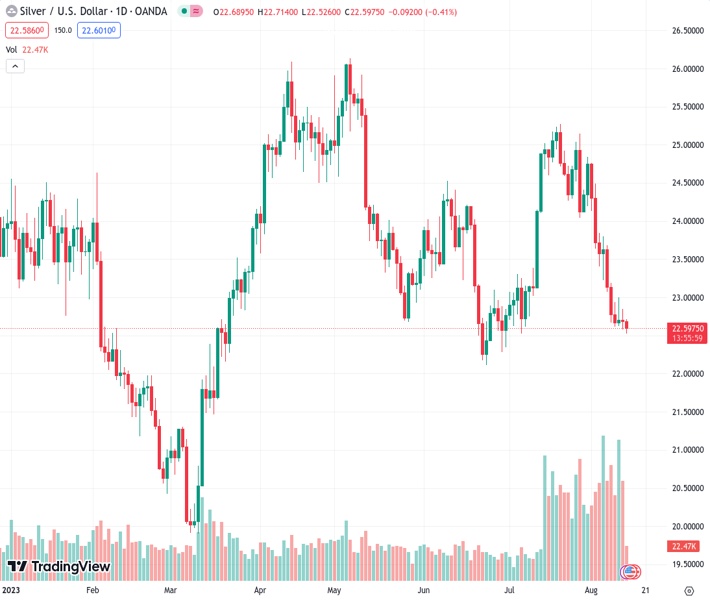
- Silver consolidates the recent losses to its lowest level since July 7 touched this Monday.
The pair currently trades last at 22.582.
The previous day high was 22.84 while the previous day low was 22.58. The daily 38.2% Fib levels comes at 22.68, expected to provide resistance. Similarly, the daily 61.8% fib level is at 22.74, expected to provide resistance.
Silver kicks off the new week on a softer note and touches a fresh low since July 7 during the Asian session, though lacks follow-through selling. The white metal now seems to have entered a bearish consolidation phase and is seen oscillating in a narrow trading band just above mid–$22.00s. The technical setup, meanwhile, remains tilted in favour of bearish traders and suggests that the path of least resistance for the XAG/USD is to the downside.
Against the backdrop of the recent decline witnessed over the past three weeks or so, the subdued range-bound price action might still be categorized as a bearish consolidation phase. Moreover, last week’s breakdown through a short-term ascending trend line extending from June swing low and the very important 200-day Simple Moving Average (SMA) adds credence to the bearish outlook for the XAG/USD. This, along with the fact that technical indicators on the daily chart are holding deep in the negative territory and are still far from being in the oversold zone, supports prospects for a further depreciating move.
Hence, a subsequent slide back towards retesting the multi-month low, around the $22.15-$22.10 area touched in June, looks like a distinct possibility. Some follow-through selling below the $22.00 mark will expose the $21.55-$21.50 intermediate support and the $21.00 mark. The downward trajectory could get extended towards the $21.00 round figure en route to the YTD low, or levels just below the $20.00 psychological mark touched in March.
On the flip side, attempted recovery back towards the $23.00 round figure might still be seen as a selling opportunity and remain capped near the $23.20-$23.30 confluence support breakpoint, now turned resistance. The latter should act as a pivotal point, which if cleared decisively might trigger a short-covering move. The XAG/USD might then accelerate the recovery momentum towards the $23.60-$23.65 horizontal barrier before aiming to reclaim the $24.00 mark.
Technical Levels: Supports and Resistances
XAGUSD currently trading at 22.61 at the time of writing. Pair opened at 22.69 and is trading with a change of -0.35 % .
| Overview | Overview.1 | |
|---|---|---|
| 0 | Today last price | 22.61 |
| 1 | Today Daily Change | -0.08 |
| 2 | Today Daily Change % | -0.35 |
| 3 | Today daily open | 22.69 |
The pair remains strongly bearish on the daily time frame. It trades below the 20 SMA @ 24.04, 50 SMA 23.66, 100 SMA @ 24.05 and 200 SMA @ 23.26.
| Trends | Trends.1 | |
|---|---|---|
| 0 | Daily SMA20 | 24.04 |
| 1 | Daily SMA50 | 23.66 |
| 2 | Daily SMA100 | 24.05 |
| 3 | Daily SMA200 | 23.26 |
The previous day high was 22.84 while the previous day low was 22.58. The daily 38.2% Fib levels comes at 22.68, expected to provide resistance. Similarly, the daily 61.8% fib level is at 22.74, expected to provide resistance.
Note the levels of interest below:
- Pivot support is noted at 22.56, 22.43, 22.29
- Pivot resistance is noted at 22.83, 22.97, 23.1
| Levels | Levels.1 |
|---|---|
| Previous Daily High | 22.84 |
| Previous Daily Low | 22.58 |
| Previous Weekly High | 23.68 |
| Previous Weekly Low | 22.58 |
| Previous Monthly High | 25.27 |
| Previous Monthly Low | 22.52 |
| Daily Fibonacci 38.2% | 22.68 |
| Daily Fibonacci 61.8% | 22.74 |
| Daily Pivot Point S1 | 22.56 |
| Daily Pivot Point S2 | 22.43 |
| Daily Pivot Point S3 | 22.29 |
| Daily Pivot Point R1 | 22.83 |
| Daily Pivot Point R2 | 22.97 |
| Daily Pivot Point R3 | 23.10 |
[/s2If]
Download Nehcap EAWe have two EAs that are operational on our LIVE accounts.
- EA-FIX: Check out the details here. Download EA-FIX . EA-FIX is a non-grid HFT scalper.
- EA-GROWTH: High quality low dd EA using trend grids. Download EA_GROWTHJoin Our Telegram Group
")


