The AUDUSD pair is experiencing slight increases, currently trading around 0.7575, corresponding to a 0.06% gain so far today.
…
This is a premium post.
[s2If !current_user_can(access_s2member_level4)]Please register for FREE REGISTER to read full post below containing analysis. In case of any error or you think you are not able to read the full post below, please email us at support#nehcap.com [lwa][/s2If] [s2If current_user_can(access_s2member_level1)]
- AUD/USD posts modest gains around 0.7575, up 0.06% for the day.
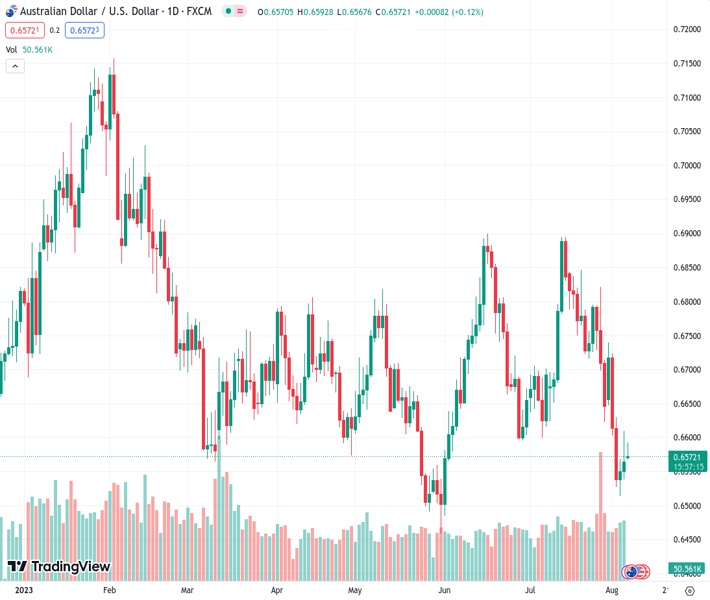
The pair currently trades last at 0.65740.
The previous day high was 0.661 while the previous day low was 0.6543. The daily 38.2% Fib levels comes at 0.6584, expected to provide resistance. Similarly, the daily 61.8% fib level is at 0.6568, expected to provide support.
The AUD/USD pair kicks off the new week on a positive note and gains traction near 0.6575 during the Asian session on Monday. The uptick in the Aussie is supported by the softer US employment data released on Friday.
The US Bureau of Labor Statistics (BLS) reported on Friday that the Nonfarm Payrolls in the US rose 187,000 in July, worse than expected by 200,000. The figures in June were revised down to 185,000. This marked the lowest reading since December 2020.
Meanwhile, the Unemployment Rate fell to 3.5% from 3.6%. The annual wage inflation, as measured by changes in Average Hourly Earnings, came in at 4.4%, higher than the market estimation of 4.2%. Finally, the Labour Force Participation remained unchanged at 62.6%. The softer data indicated a sluggish labour market in the US, which could convince the Federal Reserve (Fed) to lower interest rates and cap the upside for the USD.
On the Aussie front, Reserve Bank of Australia (RBA) Governor Phillip Lowe remarked that the decision to keep rates intact gives the RBA more time to analyse the impact of the interest rate hikes and the economic outlook. However, more monetary policy tightening may be necessary to guarantee that inflation returns to target in a reasonable timeframe, but this will depend on the data and the developing risk assessment.
About the data, the Australian Bureau of Statistics (ABS) showed last week that the Australian Trade Balance was A$11,321M, marginally lower than the A$11.791M recorded in May. Exports declined 2% as coal, mineral fuels, and metals shipments slowed in response to a decline in commodity demand in China. However, the decline in exports was offset by a 4% decline in imports in May. Meanwhile, Retail Sales QoQ came in at -0.5% from -0.6% prior.
Furthermore, the Chinese Ministry of Commerce announced on Friday that China will lift its anti-dumping and anti-subsidy tariffs on Australian barley imports effective August 5. This, in turn, boosts the Australian Dollar against its rivals.
It’s worth noting that China’s Caixin Services PMI climbed to 54.1 in July from 53.9 prior, better than the market consensus of 52.5. The upbeat Chinese economic figure could also benefit the China-proxy Australian Dollar (AUD).
Market participants will digest the data on Friday due to the absence of the economic data release from Australia on the Bank holiday. On Wednesday, attention will shift to the Chinese Consumer Price Index (CPI) YoY. Also, the US Consumer Price Index (CPI) for July and the Produce Price Index (PPI) will be due later this week. Market players anticipate a 0.2% monthly increase in US CPI. The data will be critical for determining a clear movement for the AUD/USD pair.
Technical Levels: Supports and Resistances
AUDUSD currently trading at 0.6573 at the time of writing. Pair opened at 0.6569 and is trading with a change of 0.06 % .
| Overview | Overview.1 | |
|---|---|---|
| 0 | Today last price | 0.6573 |
| 1 | Today Daily Change | 0.0004 |
| 2 | Today Daily Change % | 0.0600 |
| 3 | Today daily open | 0.6569 |
The pair remains strongly bearish on the daily time frame. It trades below the 20 SMA @ 0.6721, 50 SMA 0.6702, 100 SMA @ 0.6689 and 200 SMA @ 0.6733.
| Trends | Trends.1 | |
|---|---|---|
| 0 | Daily SMA20 | 0.6721 |
| 1 | Daily SMA50 | 0.6702 |
| 2 | Daily SMA100 | 0.6689 |
| 3 | Daily SMA200 | 0.6733 |
The previous day high was 0.661 while the previous day low was 0.6543. The daily 38.2% Fib levels comes at 0.6584, expected to provide resistance. Similarly, the daily 61.8% fib level is at 0.6568, expected to provide support.
Note the levels of interest below:
- Pivot support is noted at 0.6538, 0.6507, 0.6471
- Pivot resistance is noted at 0.6605, 0.6641, 0.6672
| Levels | Levels.1 |
|---|---|
| Previous Daily High | 0.6610 |
| Previous Daily Low | 0.6543 |
| Previous Weekly High | 0.6740 |
| Previous Weekly Low | 0.6514 |
| Previous Monthly High | 0.6895 |
| Previous Monthly Low | 0.6599 |
| Daily Fibonacci 38.2% | 0.6584 |
| Daily Fibonacci 61.8% | 0.6568 |
| Daily Pivot Point S1 | 0.6538 |
| Daily Pivot Point S2 | 0.6507 |
| Daily Pivot Point S3 | 0.6471 |
| Daily Pivot Point R1 | 0.6605 |
| Daily Pivot Point R2 | 0.6641 |
| Daily Pivot Point R3 | 0.6672 |
[/s2If]
Download Nehcap EAWe have two EAs that are operational on our LIVE accounts.
- EA-FIX: Check out the details here. Download EA-FIX . EA-FIX is a non-grid HFT scalper.
- EA-GROWTH: High quality low dd EA using trend grids. Download EA_GROWTHJoin Our Telegram Group


