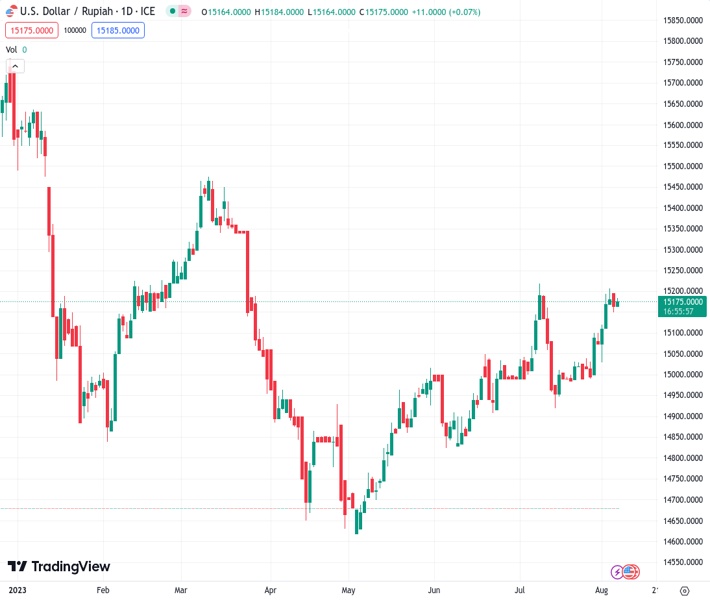
Despite the Q2 Indonesia GDP performing better than expected, the USDIDR is holding onto slight gains around its intraday high.
…
This is a premium post.
[s2If !current_user_can(access_s2member_level4)]Please register for FREE REGISTER to read full post below containing analysis. In case of any error or you think you are not able to read the full post below, please email us at support#nehcap.com [lwa][/s2If] [s2If current_user_can(access_s2member_level1)]
- USD/IDR clings to mild gains around intraday high despite better-than-prior Q2 Indonesia GDP.
The pair currently trades last at 15175.0.
The previous day high was 15215.95 while the previous day low was 15102.7. The daily 38.2% Fib levels comes at 15172.6885, expected to provide support. Similarly, the daily 61.8% fib level is at 15145.9615, expected to provide support.
USD/IDR holds onto the previous day’s recovery moves as it sticks to mild gains near 15,185 amid early Monday morning in Europe. In doing so, the Indonesia Rupiah (IDR) pair fails to justify the upbeats results of Indonesia’s second quarter (Q2) Gross Domestic Product (GDP) figures. That said, the reason could be linked to the US Dollar’s upbeat performance ahead of the headlines inflation data.
Indonesia’s Q2 GDP rose to 3.86% QoQ and 5.17% YoY versus 3.72% and 4.93% respective market expectations. It’s worth noting that the growth numbers were -0.92% QoQ and 5.03% YoY in the first quarter (Q1) of 2023.
In contrast to the upbeat Indonesia growth numbers, escalating fears from typhoon Doksuri in China weigh on the IDR. With this, stocks in China and Hong Kong print mild losses even as Beijing hints at further stimulus to defend the economy.
On the other hand, the US Dollar Index snaps a two-day downtrend with mild gains around 102.16 backed by the weekend comments from Federal Reserve (Fed) Governor Michelle Bowman. “Fed should remain willing to raise the federal funds rate at a future meeting if the incoming data indicate that progress on inflation has stalled,” said Fed’s Bowman on Saturday.
Previously, the US Dollar dropped in the last two consecutive days amid mixed Fed talks and US data. On Friday, Atlanta Federal Reserve Bank President Raphael Bostic said to Bloomberg that the central bank is likely to keep monetary policy in a restrictive territory well into 2024. However, Chicago Fed President Austan Goolsbee stated that they should start thinking about how long to hold rates.
Meanwhile, the US employment report posted a softer-than-expected Nonfarm Payrolls (NFP) figure of 187K, versus 185K prior (revised) and 200K market forecasts, whereas the Unemployment Rate eased to 3.5% from 3.6% expected and previous readings. Further, the Average Hourly Earnings reprinted 0.4% MoM and 4.4% YoY numbers by defying the expectations of witnessing a slight reduction in wage growth.
Looking forward, Wednesday’s Indonesia Retail Sales for June may entertain the USD/IDR pair traders ahead of Thursday’s US Consumer Price Index (CPI) and Friday’s Producer Price Index (PPI) for July.
USD/IDR justifies Friday’s bullish Doji candlestick to lure buyers amid the bullish MACD signals and upbeat RSI (14) line. However, a daily closing beyond the 200-DMA hurdle surrounding 15,185 becomes necessary for the Indian Rupiah (IDR) pair to aim for the previous weekly high of around 15,230.
Technical Levels: Supports and Resistances
USDIDR currently trading at 15182 at the time of writing. Pair opened at 15152.9 and is trading with a change of 0.19% % .
| Overview | Overview.1 | |
|---|---|---|
| 0 | Today last price | 15182 |
| 1 | Today Daily Change | 29.1000 |
| 2 | Today Daily Change % | 0.19% |
| 3 | Today daily open | 15152.9 |
The pair is trading above its 20 Daily moving average @ 15062.4675, above its 50 Daily moving average @ 15008.855 , above its 100 Daily moving average @ 14957.166 and below its 200 Daily moving average @ 15186.192
| Trends | Trends.1 | |
|---|---|---|
| 0 | Daily SMA20 | 15062.4675 |
| 1 | Daily SMA50 | 15008.8550 |
| 2 | Daily SMA100 | 14957.1660 |
| 3 | Daily SMA200 | 15186.1920 |
The previous day high was 15215.95 while the previous day low was 15102.7. The daily 38.2% Fib levels comes at 15172.6885, expected to provide support. Similarly, the daily 61.8% fib level is at 15145.9615, expected to provide support.
Note the levels of interest below:
- Pivot support is noted at 15098.4167, 15043.9333, 14985.1667
- Pivot resistance is noted at 15211.6667, 15270.4333, 15324.9167
| Levels | Levels.1 |
|---|---|
| Previous Daily High | 15215.9500 |
| Previous Daily Low | 15102.7000 |
| Previous Weekly High | 15230.0000 |
| Previous Weekly Low | 15062.9500 |
| Previous Monthly High | 15916.7000 |
| Previous Monthly Low | 13588.0000 |
| Daily Fibonacci 38.2% | 15172.6885 |
| Daily Fibonacci 61.8% | 15145.9615 |
| Daily Pivot Point S1 | 15098.4167 |
| Daily Pivot Point S2 | 15043.9333 |
| Daily Pivot Point S3 | 14985.1667 |
| Daily Pivot Point R1 | 15211.6667 |
| Daily Pivot Point R2 | 15270.4333 |
| Daily Pivot Point R3 | 15324.9167 |
[/s2If]
Download Nehcap EAWe have two EAs that are operational on our LIVE accounts.
- EA-FIX: Check out the details here. Download EA-FIX . EA-FIX is a non-grid HFT scalper.
- EA-GROWTH: High quality low dd EA using trend grids. Download EA_GROWTHJoin Our Telegram Group


