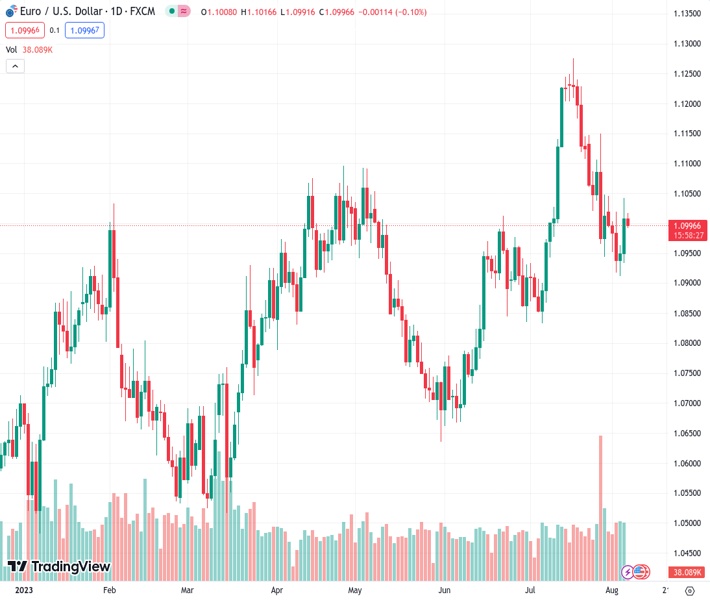
The EURUSD pair, currently valued at 1.09963, is experiencing selling activities and is being negatively affected by an increasing demand for USD.
…
This is a premium post.
[s2If !current_user_can(access_s2member_level4)]Please register for FREE REGISTER to read full post below containing analysis. In case of any error or you think you are not able to read the full post below, please email us at support#nehcap.com [lwa][/s2If] [s2If current_user_can(access_s2member_level1)]
- EUR/USD comes under some selling pressure and is undermined by reviving USD demand.
The pair currently trades last at 1.09963.
The previous day high was 1.1042 while the previous day low was 1.0935. The daily 38.2% Fib levels comes at 1.1001, expected to provide resistance. Similarly, the daily 61.8% fib level is at 1.0976, expected to provide support.
The EUR/USD pair meets with some supply on the first day of a new week and retreats further from a four-day peak, around the 1.1040 area touched in reaction to the rather unimpressive headline US NFP print on Friday. Spot prices slip back below the 1.1000 psychological mark during the Asian session and for now, seem to have stalled a two-day-old recovery from the 100-day Simple Moving Average (SMA), around the 1.0910 area, or a nearly one-month low touched last Thursday.
The US Dollar (USD) attracts some dip-buying in the wake of growing acceptance that the Federal Reserve (Fed) will stick to its hawkish stance and turns out to be a key factor exerting some pressure on the EUR/USD pair. The closely-watched US monthly employment details showed that the economy added 187K jobs in July, which, along with a downward revision of readings for May and June, suggested demand for workers was slowing. That said, solid wage growth and an unexpected downtick in the unemployment rate pointed to continued tightness in the labour market. This keeps the door for one more 25 bps rate hike by the Federal Reserve (Fed) in September or November wide open and lends some support to the buck.
The shared currency, on the other hand, is undermined by expectations that the European Central Bank (ECB) will halt its streak of nine consecutive interest rate hikes in September amid signs that the underlying inflation in the Euro Zone has peaked. In fact, Fitch Ratings said on Friday that falling Euro Zone inflation puts ECB rates peak within sight. Moreover, the ECB, in its economic bulletin published on Friday, noted that the ECB noted that the underlying inflation in the region likely peaked during the first half of 2023. This is seen as another factor that contributes to the offered tone surrounding the EUR/USD pair. Bears, however, might refrain from placing aggressive bets ahead of this week’s release of the US inflation figures.
The crucial US CPI report is due on Thursday, which will play a key role in influencing market expectations about the Fed’s future rate-hike path and driving the USD demand. In the meantime, traders on Monday will take cues from the Euro Zone macro data – German Industrial Production and Sentix Investor Confidence. Meanwhile, there isn’t any relevant economic data due for release from the US, leaving the USD at the mercy of speeches by a slew of FOMC members. Any policy-related remarks might provide some impetus to the buck and allow traders to grab short-term opportunities around the EUIR/USD pair. Nevertheless, the aforementioned fundamental backdrop suggests that the path of least resistance for spot prices is to the downside.
Technical Levels: Supports and Resistances
EURUSD currently trading at 1.0994 at the time of writing. Pair opened at 1.1009 and is trading with a change of -0.14 % .
| Overview | Overview.1 | |
|---|---|---|
| 0 | Today last price | 1.0994 |
| 1 | Today Daily Change | -0.0015 |
| 2 | Today Daily Change % | -0.1400 |
| 3 | Today daily open | 1.1009 |
The pair is trading below its 20 Daily moving average @ 1.108, above its 50 Daily moving average @ 1.0937 , above its 100 Daily moving average @ 1.092 and above its 200 Daily moving average @ 1.0745
| Trends | Trends.1 | |
|---|---|---|
| 0 | Daily SMA20 | 1.1080 |
| 1 | Daily SMA50 | 1.0937 |
| 2 | Daily SMA100 | 1.0920 |
| 3 | Daily SMA200 | 1.0745 |
The previous day high was 1.1042 while the previous day low was 1.0935. The daily 38.2% Fib levels comes at 1.1001, expected to provide resistance. Similarly, the daily 61.8% fib level is at 1.0976, expected to provide support.
Note the levels of interest below:
- Pivot support is noted at 1.0948, 1.0888, 1.0841
- Pivot resistance is noted at 1.1055, 1.1102, 1.1162
| Levels | Levels.1 |
|---|---|
| Previous Daily High | 1.1042 |
| Previous Daily Low | 1.0935 |
| Previous Weekly High | 1.1046 |
| Previous Weekly Low | 1.0912 |
| Previous Monthly High | 1.1276 |
| Previous Monthly Low | 1.0834 |
| Daily Fibonacci 38.2% | 1.1001 |
| Daily Fibonacci 61.8% | 1.0976 |
| Daily Pivot Point S1 | 1.0948 |
| Daily Pivot Point S2 | 1.0888 |
| Daily Pivot Point S3 | 1.0841 |
| Daily Pivot Point R1 | 1.1055 |
| Daily Pivot Point R2 | 1.1102 |
| Daily Pivot Point R3 | 1.1162 |
[/s2If]
Download Nehcap EAWe have two EAs that are operational on our LIVE accounts.
- EA-FIX: Check out the details here. Download EA-FIX . EA-FIX is a non-grid HFT scalper.
- EA-GROWTH: High quality low dd EA using trend grids. Download EA_GROWTHJoin Our Telegram Group


