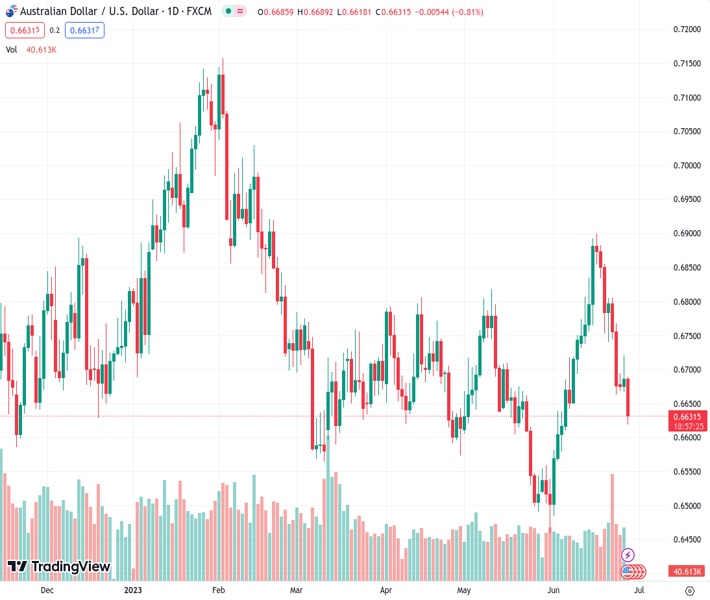
The AUDUSD pair experiences new selling pressure on Wednesday and plunges to its lowest level in over three weeks.
…
This is a premium post.
[s2If !current_user_can(access_s2member_level4)]Please register for FREE REGISTER to read full post below containing analysis. In case of any error or you think you are not able to read the full post below, please email us at support#nehcap.com [lwa][/s2If] [s2If current_user_can(access_s2member_level1)]
- AUD/USD comes under fresh selling pressure on Wednesday and dives to over a three-week low.
The pair currently trades last at 0.66310.
The previous day high was 0.6721 while the previous day low was 0.667. The daily 38.2% Fib levels comes at 0.6701, expected to provide resistance. Similarly, the daily 61.8% fib level is at 0.669, expected to provide resistance.
The AUD/USD pair meets with a fresh supply during the Asian session on Wednesday and dives to the 0.6620-0.6615 area, or over a three-week low in reaction to softer-than-expected Australian consumer inflation figures.
The Australian Bureau of Statistics reported that the headline CPI decelerated to the 5.6% YoY rate in May from 6.8% in the previous month. This eases expectations for further interest rate hikes by the Reserve Bank of Australia (RBA), which, along with worries about the worsening US-China relations, weigh on the Australian Dollar (AUD). In fact, the Wall Street Journal, citing people familiar with the matter, reported on Tuesday that the Biden administration is considering new restrictions on exports of artificial intelligence chips to China.
This, to a larger extent, overshadows the optimism led by Chinese Premier Li Qiang’s remarks, saying economic growth in the second quarter will be higher than the first and is expected to reach the annual projected target of around 5%. Apart from this, a modest US Dollar (USD) uptick turns out to be another factor exerting some downward pressure on the AUD/USD pair and contributing to the ongoing downfall. Against the backdrop of the Federal Reserve’s (Fed) hawkish outlook, Tuesday’s upbeat US macro acts as a tailwind for the Greenback.
It is worth recalling that the Fed had signalled that borrowing may still need to rise as much as 50 bps by the end of this year. Furthermore, Fed Chair Jerome Powell said last week that the US central bank doesn’t see rate cuts happening any time soon and is going to wait until it is confident that inflation is moving down to the 2% medium-term target. Hence, the market focus will remain glued to Powell’s comments during a panel discussion at the ECB Forum on Central Banking in Sintra, due later this Wednesday and on Thursday.
Investors will look for fresh clues about the Fed’s future rate-hike move, which, in turn, will play a key role in influencing the USD price dynamics and provide some meaningful impetus to the AUD/USD pair. The attention will then shift to the release of the Fed’s preferred inflation gauge – the US Core PCE Price Index on Friday.
Technical Levels: Supports and Resistances
AUDUSD currently trading at 0.6665 at the time of writing. Pair opened at 0.6686 and is trading with a change of -0.31 % .
| Overview | Overview.1 | |
|---|---|---|
| 0 | Today last price | 0.6665 |
| 1 | Today Daily Change | -0.0021 |
| 2 | Today Daily Change % | -0.3100 |
| 3 | Today daily open | 0.6686 |
The pair remains strongly bearish on the daily time frame. It trades below the 20 SMA @ 0.6719, 50 SMA 0.6679, 100 SMA @ 0.6709 and 200 SMA @ 0.6692.
| Trends | Trends.1 | |
|---|---|---|
| 0 | Daily SMA20 | 0.6719 |
| 1 | Daily SMA50 | 0.6679 |
| 2 | Daily SMA100 | 0.6709 |
| 3 | Daily SMA200 | 0.6692 |
The previous day high was 0.6721 while the previous day low was 0.667. The daily 38.2% Fib levels comes at 0.6701, expected to provide resistance. Similarly, the daily 61.8% fib level is at 0.669, expected to provide resistance.
Note the levels of interest below:
- Pivot support is noted at 0.6664, 0.6642, 0.6613
- Pivot resistance is noted at 0.6715, 0.6743, 0.6766
| Levels | Levels.1 |
|---|---|
| Previous Daily High | 0.6721 |
| Previous Daily Low | 0.6670 |
| Previous Weekly High | 0.6886 |
| Previous Weekly Low | 0.6663 |
| Previous Monthly High | 0.6818 |
| Previous Monthly Low | 0.6458 |
| Daily Fibonacci 38.2% | 0.6701 |
| Daily Fibonacci 61.8% | 0.6690 |
| Daily Pivot Point S1 | 0.6664 |
| Daily Pivot Point S2 | 0.6642 |
| Daily Pivot Point S3 | 0.6613 |
| Daily Pivot Point R1 | 0.6715 |
| Daily Pivot Point R2 | 0.6743 |
| Daily Pivot Point R3 | 0.6766 |
[/s2If]
Nehcap Expert Advisor
The NEHCAP MT4 EA is high quality professional trading system geared to generate returns without using GRID or martingales. Each trade has strict risk per trade parameter. The pairs under management include EURUSD, GBPUSD, AUDCAD, AUDNZD,GBPAUD, EURAUD, EURCAD, CHFJPY and many more.
The system is trading live: LIVE ACCOUNT TRACKING
You can run it free. Apply for a free trial and track our account. Buy the system or use profit share mechanism to generate returns on your MT4.
Join Our Telegram Group
")


