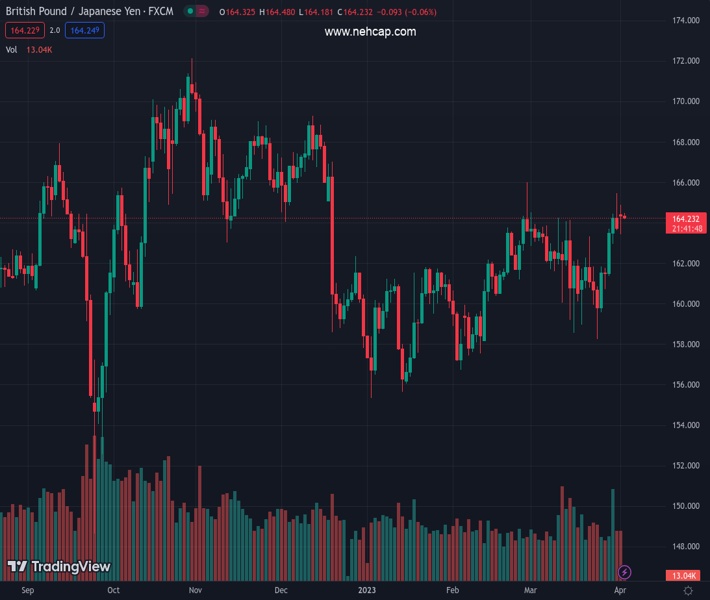
#GBPJPY @ 164.274 failed to break strong resistance at the confluence of technical indicators. (Pivot Orderbook analysis)
…
This is a premium post.
[s2If !current_user_can(access_s2member_level4)]Please register for PREMIUM VERSION HERE to read full post below containing analysis. In case of any error or you think you are not able to read the full post below, please email us at support#nehcap.com [lwa][/s2If] [s2If current_user_can(access_s2member_level4)]
- GBP/JPY failed to break strong resistance at the confluence of technical indicators.
- A bearish scenario lies below 164.00, exposing crucial moving averages.
- On the upside, the GBP/JPY can test the YTD high at 166.00.
The pair currently trades last at 164.274.
The previous day high was 165.47 while the previous day low was 163.63. The daily 38.2% Fib levels comes at 164.33, expected to provide resistance. Similarly, the daily 61.8% fib level is at 164.77, expected to provide resistance.
GBP/JPY barely advanced as the Asian session began after Monday’s rally challenged resistance but failed to capitalize on an upbeat sentiment. At the time of writing, the GBP/JPY exchanges hand at 164.32, consolidating within a 180-pip range.
In the last few days, the GBP/JPY price action printed back-to-back candles that portray the uptrend are fading. Last Friday’s, an inverted hammer, followed by a dragonfly doji, depicts indecision amongst the GBP/JPY traders. Additionally, a four-month-old resistance trendline that passes around the 164.30-50 area capped any upward moves, suggesting that a pullback could be underway.
Oscillators like the Relative Strength Index (RSI) at bullish territory turned flat as buying pressure faded. The Rate of Change (RoC), turned neutral, opening the door for a retracement.
Should a bearish scenario arise, the GBP/JPY could pivot toward the 20-day Exponential Moving Average (EMA) at 162.53 before challenging the 100-day EMA At 162.20. A breach of the latter will expose the 50-day EMA at 162.03 before testing the 200-day EMA at 161.98.
For a bullish resumption, the GBP/JPY must crack 164.50, which, once cleared, and the pair would be heading to test two-month highs at 166.00. On further strength, the next upside target to keep in mind would be the December 13 daily high at 169.27.
Technical Levels: Supports and Resistances
GBPJPY currently trading at 164.34 at the time of writing. Pair opened at 163.9 and is trading with a change of 0.27 % .
| Overview | Overview.1 | |
|---|---|---|
| 0 | Today last price | 164.34 |
| 1 | Today Daily Change | 0.44 |
| 2 | Today Daily Change % | 0.27 |
| 3 | Today daily open | 163.90 |
The pair remains strongly bullish on the daily timeframe. It trades above its 20 SMA @ 162.08, 50 SMA 161.49, 100 SMA @ 162.35 and 200 SMA @ 163.17.
| Trends | Trends.1 | |
|---|---|---|
| 0 | Daily SMA20 | 162.08 |
| 1 | Daily SMA50 | 161.49 |
| 2 | Daily SMA100 | 162.35 |
| 3 | Daily SMA200 | 163.17 |
The previous day high was 165.47 while the previous day low was 163.63. The daily 38.2% Fib levels comes at 164.33, expected to provide resistance. Similarly, the daily 61.8% fib level is at 164.77, expected to provide resistance.
Note the levels of interest below:
- Pivot support is noted at 163.2, 162.49, 161.35
- Pivot resistance is noted at 165.04, 166.18, 166.89
| Levels | Levels.1 |
|---|---|
| Previous Daily High | 165.47 |
| Previous Daily Low | 163.63 |
| Previous Weekly High | 165.47 |
| Previous Weekly Low | 159.66 |
| Previous Monthly High | 165.47 |
| Previous Monthly Low | 158.27 |
| Daily Fibonacci 38.2% | 164.33 |
| Daily Fibonacci 61.8% | 164.77 |
| Daily Pivot Point S1 | 163.20 |
| Daily Pivot Point S2 | 162.49 |
| Daily Pivot Point S3 | 161.35 |
| Daily Pivot Point R1 | 165.04 |
| Daily Pivot Point R2 | 166.18 |
| Daily Pivot Point R3 | 166.89 |
[/s2If]
Join Our Telegram Group
")


