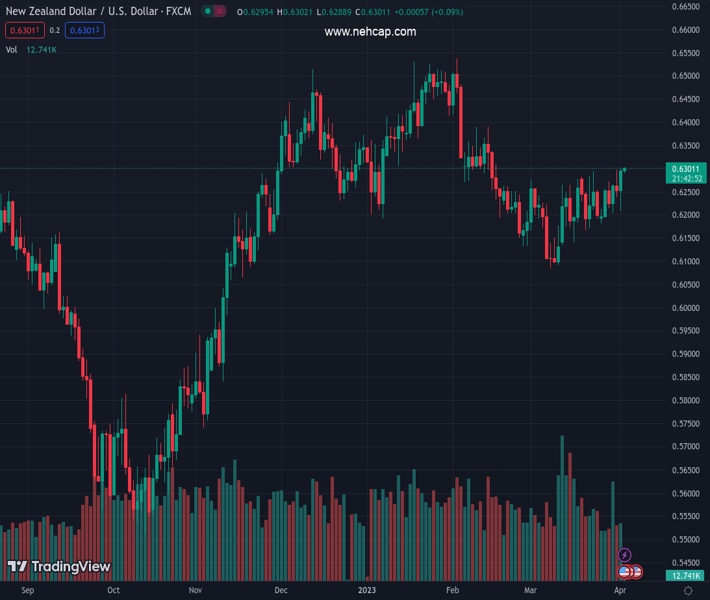
#NZDUSD @ 0.63013 is expected to extend its upside journey above 0.6300 as Fed-RBNZ policy divergence would scrap. (Pivot Orderbook analysis)
…
This is a premium post.
[s2If !current_user_can(access_s2member_level4)]Please register for PREMIUM VERSION HERE to read full post below containing analysis. In case of any error or you think you are not able to read the full post below, please email us at support#nehcap.com [lwa][/s2If] [s2If current_user_can(access_s2member_level4)]
- NZD/USD is expected to extend its upside journey above 0.6300 as Fed-RBNZ policy divergence would scrap.
- A 25 bps rate hike is expected from the RBNZ to 5%, the highest since December 2008.
- Downbeat US ISM Manufacturing PMI has raised concerns about further policy-tightening by the Fed.
The pair currently trades last at 0.63013.
The previous day high was 0.6298 while the previous day low was 0.6237. The daily 38.2% Fib levels comes at 0.6261, expected to provide support. Similarly, the daily 61.8% fib level is at 0.6275, expected to provide support.
The NZD/USD pair is hovering near the round-level resistance of 0.6300 in the Asian session. The Kiwi asset is expected to deliver a break above the aforementioned resistance as the interest rate decision by the Reserve Bank of New Zealand (RBNZ) on Wednesday is expected to scrap the Federal Reserve (Fed)-RBNZ policy divergence ahead.
In a March 27-30 Reuters poll, over 90% of economists said RBNZ Governor Adrian Orr would hike the Official Cash Rate (OCR) by 25 basis points (bps) to 5.00% at its April 5 meeting, the highest since December 2008. Reuters further added New Zealand’s economy is expected to have shrunk by 0.3% this quarter, following a 0.6% contraction in the final three months of 2022, indicating a mild recession that is likely to prompt the RBNZ to slow its torrid pace of rate hikes.
Meanwhile, S&P500 futures are showing some losses in the early Asian session after a positive settlement on Monday, portraying minor caution in the overall risk appetite theme.
Caution has been stemmed in the market as United States Treasury Secretary Janet Yellen believes that the surprise announcement of oil production cuts by OPEC+ will add uncertainty to the global growth outlook. Higher oil prices are expected to strengthen a rebound in global headline inflation figures, which would refresh troubles for central banks ahead.
The US Dollar Index (DXY) is likely to extend its downside further below the immediate support of 102.00 as the release of the downbeat US ISM Manufacturing PMI has raised concerns about further policy-tightening by the Federal Reserve (Fed).
For further guidance, Wednesday’s US Automatic Data Processing (ADP) Employment Change (March) data will remain in the spotlight. As per the consensus, the economic data will release lower at 205K vs. the prior release of 242K.
Technical Levels: Supports and Resistances
NZDUSD currently trading at 0.6298 at the time of writing. Pair opened at 0.6261 and is trading with a change of 0.59 % .
| Overview | Overview.1 | |
|---|---|---|
| 0 | Today last price | 0.6298 |
| 1 | Today Daily Change | 0.0037 |
| 2 | Today Daily Change % | 0.5900 |
| 3 | Today daily open | 0.6261 |
The pair remains strongly bullish on the daily timeframe. It trades above its 20 SMA @ 0.6204, 50 SMA 0.6279, 100 SMA @ 0.6295 and 200 SMA @ 0.6159.
| Trends | Trends.1 | |
|---|---|---|
| 0 | Daily SMA20 | 0.6204 |
| 1 | Daily SMA50 | 0.6279 |
| 2 | Daily SMA100 | 0.6295 |
| 3 | Daily SMA200 | 0.6159 |
The previous day high was 0.6298 while the previous day low was 0.6237. The daily 38.2% Fib levels comes at 0.6261, expected to provide support. Similarly, the daily 61.8% fib level is at 0.6275, expected to provide support.
Note the levels of interest below:
- Pivot support is noted at 0.6233, 0.6205, 0.6173
- Pivot resistance is noted at 0.6294, 0.6326, 0.6354
| Levels | Levels.1 |
|---|---|
| Previous Daily High | 0.6298 |
| Previous Daily Low | 0.6237 |
| Previous Weekly High | 0.6298 |
| Previous Weekly Low | 0.6180 |
| Previous Monthly High | 0.6298 |
| Previous Monthly Low | 0.6084 |
| Daily Fibonacci 38.2% | 0.6261 |
| Daily Fibonacci 61.8% | 0.6275 |
| Daily Pivot Point S1 | 0.6233 |
| Daily Pivot Point S2 | 0.6205 |
| Daily Pivot Point S3 | 0.6173 |
| Daily Pivot Point R1 | 0.6294 |
| Daily Pivot Point R2 | 0.6326 |
| Daily Pivot Point R3 | 0.6354 |
[/s2If]
Join Our Telegram Group
")


