The USD Index is expected to drift below 102.00 as the risk-on mood remains firmer. (Pivot Orderbook analysis)
…
This is a premium post.
[s2If !current_user_can(access_s2member_level4)]Please register for PREMIUM VERSION HERE to read full post below containing analysis. In case of any error or you think you are not able to read the full post below, please email us at support#nehcap.com [lwa][/s2If] [s2If current_user_can(access_s2member_level4)]
- The USD Index is expected to drift below 102.00 as the risk-on mood remains firmer.
- Weak US ISM Manufacturing PMI has prompted an early pause in Fed’s tightening spree.
- The release of the US Employment data will provide more clarity over Fed’s rate guidance.
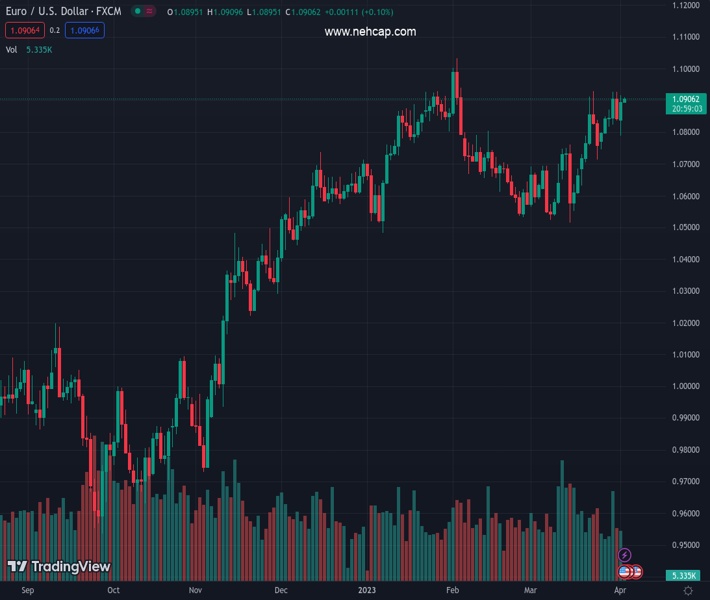
The pair currently trades last at 102.01.
The previous day high was 102.63 while the previous day low was 102.05. The daily 38.2% Fib levels comes at 102.41, expected to provide resistance. Similarly, the daily 61.8% fib level is at 102.27, expected to provide resistance.
The US Dollar Index (DXY) is displaying a back-and-forth action above the immediate support of 102.00 in the Asian session. The asset is prone to print a fresh two-month low below 102.00 as the risk appetite theme is underpinned by investors after inspiring by the anticipation of a pause in the policy-tightening process by the Federal Reserve (Fed).
S&P500 futures are showing nominal losses in the early Asian session. United States equities settled Monday’s session on a positive note as the Fed would announce an early pause to the rate-hiking spell. This led to a jump in the demand for US government bonds. The 10-year US Treasury yields have slipped to near 3.41%. The commentary from US Treasury Secretary Janet Yellen that the surprise announcement of oil production cuts by OPEC+ will add uncertainty to the global growth outlook has failed to spoil the upbeat market mood.
The release of the downbeat US ISM Manufacturing PMI data on Monday has raised the chances of a recession in the economy. Monday’s Manufacturing PMI landed below 50.0 straight for the fifth time as higher rates by Fed chair Jerome Powell have trimmed the overall demand. A figure of 50.0 acts as a silver line that separates growth from contraction. The economic data contracted to 46.3 from the consensus of 47.5 and the former release of 47.7.
Apart from that, the New Orders Index that conveys forward demand has contracted to 44.3 from the expectations of 44.6, indicating a subdued demand outlook. Therefore, the Fed could consider a pause in the policy-tightening spell to trim accelerating recession fears ahead.
Investors would get meaningful clarity about the interest rate guidance after the release of the US Nonfarm Payrolls (NFP), which will release on Friday. Vigorous demand for labor would indicate that demand is still robust, which is why the hiring process is still active. But before that, Wednesday’s Automatic Data Processing (ADP) Employment Change (March) data will be keenly watched. As per the consensus, the economic data will release lower at 205K vs. the prior release of 242K.
Technical Levels: Supports and Resistances
EURUSD currently trading at 102.01 at the time of writing. Pair opened at 102.59 and is trading with a change of -0.57 % .
| Overview | Overview.1 | |
|---|---|---|
| 0 | Today last price | 102.01 |
| 1 | Today Daily Change | -0.58 |
| 2 | Today Daily Change % | -0.57 |
| 3 | Today daily open | 102.59 |
The pair remains strongly bearish on the daily time frame. It trades below the 20 SMA @ 103.67, 50 SMA 103.49, 100 SMA @ 103.97 and 200 SMA @ 106.64.
| Trends | Trends.1 | |
|---|---|---|
| 0 | Daily SMA20 | 103.67 |
| 1 | Daily SMA50 | 103.49 |
| 2 | Daily SMA100 | 103.97 |
| 3 | Daily SMA200 | 106.64 |
The previous day high was 102.63 while the previous day low was 102.05. The daily 38.2% Fib levels comes at 102.41, expected to provide resistance. Similarly, the daily 61.8% fib level is at 102.27, expected to provide resistance.
Note the levels of interest below:
- Pivot support is noted at 102.21, 101.84, 101.63
- Pivot resistance is noted at 102.8, 103.01, 103.38
| Levels | Levels.1 |
|---|---|
| Previous Daily High | 102.63 |
| Previous Daily Low | 102.05 |
| Previous Weekly High | 103.23 |
| Previous Weekly Low | 102.05 |
| Previous Monthly High | 105.89 |
| Previous Monthly Low | 101.92 |
| Daily Fibonacci 38.2% | 102.41 |
| Daily Fibonacci 61.8% | 102.27 |
| Daily Pivot Point S1 | 102.21 |
| Daily Pivot Point S2 | 101.84 |
| Daily Pivot Point S3 | 101.63 |
| Daily Pivot Point R1 | 102.80 |
| Daily Pivot Point R2 | 103.01 |
| Daily Pivot Point R3 | 103.38 |
[/s2If]
Join Our Telegram Group
")


