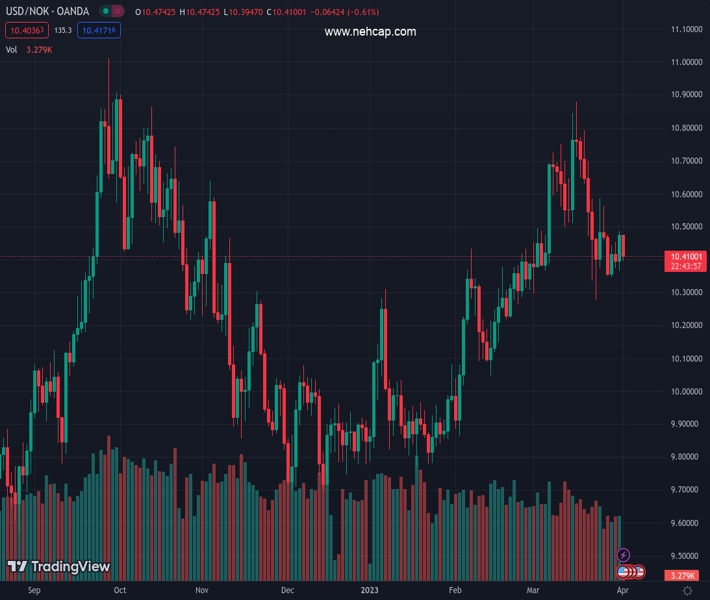
#USDNOK @ 10.45980 has delivered a gap-down open near 10.40 after a surprise oil production cut by OPEC+. (Pivot Orderbook analysis)
…
This is a premium post.
[s2If !current_user_can(access_s2member_level4)]Please register for PREMIUM VERSION HERE to read full post below containing analysis. In case of any error or you think you are not able to read the full post below, please email us at support#nehcap.com [lwa][/s2If] [s2If current_user_can(access_s2member_level4)]
- USD/NOK has delivered a gap-down open near 10.40 after a surprise oil production cut by OPEC+.
- Fresh pledge of cutting overall oil production by 1.16 million bpd has led to an overall cut of 3.66 million bpd.
- The odds for a further 25bp rate hike by the Fed remain solid despite softening of the US PCE Price Index.
The pair currently trades last at 10.45980.
The previous day high was 10.4877 while the previous day low was 10.3663. The daily 38.2% Fib levels comes at 10.4413, expected to provide support. Similarly, the daily 61.8% fib level is at 10.4127, expected to provide support.
The USD/NOK pair has witnessed an intense sell-off in the Asian session as investors discount the impact of the surprise drop in oil production announced by Saudi Arabia and other OPEC+ members. The oil cartel will cut the overall oil production by around 1.16 million barrels/day, which has strengthened the Norwegian Krone. Fresh pledge of cutting overall oil production by 1.16 million bpd has led to an overall cut of 3.66 million bpd.
The surprise move by OPEC+ in an attempt to support the oil price has strengthened the currencies of oil-exporting countries, which will receive more funds on exporting oil. Bloomberg reported that the surprise move by OPEC+ would increase the risk of higher inflationary pressures globally and might force central banks to keep policy rates higher for longer.
Meanwhile, S&P500 continued its winning spree on Friday in hopes of no further casualties to the United States banking sector, portraying a risk-on mood. However, fresh oil production cuts could spoil the market mood ahead, therefore, a cautionary approach would be advisable.
The US Dollar Index (DXY) recovered firmly on late Friday to near 102.60 despite more-than anticipated softening of US core Personal Consumption Expenditure (PCE) Price Index data. On a monthly basis, the US PCE Price Index accelerated by 0.3%, lower than the consensus of 0.4% and the former release of 0.5%. Also, the annual US PCE Inflation figure soften to 4.6% from the consensus and prior release of 4.7%. However, the move has not eased expectations of further 25 basis points (bps) rate hike by the Federal Reserve.
As per the CME Fedwatch tool, the odds for a 25bp rate hike to 5.00-5.25% for May monetary policy meeting stand more than 53%.
Technical Levels: Supports and Resistances
USDNOK currently trading at 10.426 at the time of writing. Pair opened at 10.4723 and is trading with a change of -0.44 % .
| Overview | Overview.1 | |
|---|---|---|
| 0 | Today last price | 10.4260 |
| 1 | Today Daily Change | -0.0463 |
| 2 | Today Daily Change % | -0.4400 |
| 3 | Today daily open | 10.4723 |
The pair is trading below its 20 Daily moving average @ 10.5509, above its 50 Daily moving average @ 10.326 , above its 100 Daily moving average @ 10.1347 and above its 200 Daily moving average @ 10.1356
| Trends | Trends.1 | |
|---|---|---|
| 0 | Daily SMA20 | 10.5509 |
| 1 | Daily SMA50 | 10.3260 |
| 2 | Daily SMA100 | 10.1347 |
| 3 | Daily SMA200 | 10.1356 |
The previous day high was 10.4877 while the previous day low was 10.3663. The daily 38.2% Fib levels comes at 10.4413, expected to provide support. Similarly, the daily 61.8% fib level is at 10.4127, expected to provide support.
Note the levels of interest below:
- Pivot support is noted at 10.3965, 10.3207, 10.2751
- Pivot resistance is noted at 10.5179, 10.5635, 10.6393
| Levels | Levels.1 |
|---|---|
| Previous Daily High | 10.4877 |
| Previous Daily Low | 10.3663 |
| Previous Weekly High | 10.5616 |
| Previous Weekly Low | 10.3468 |
| Previous Monthly High | 10.8784 |
| Previous Monthly Low | 10.2768 |
| Daily Fibonacci 38.2% | 10.4413 |
| Daily Fibonacci 61.8% | 10.4127 |
| Daily Pivot Point S1 | 10.3965 |
| Daily Pivot Point S2 | 10.3207 |
| Daily Pivot Point S3 | 10.2751 |
| Daily Pivot Point R1 | 10.5179 |
| Daily Pivot Point R2 | 10.5635 |
| Daily Pivot Point R3 | 10.6393 |
[/s2If]
Join Our Telegram Group
")


