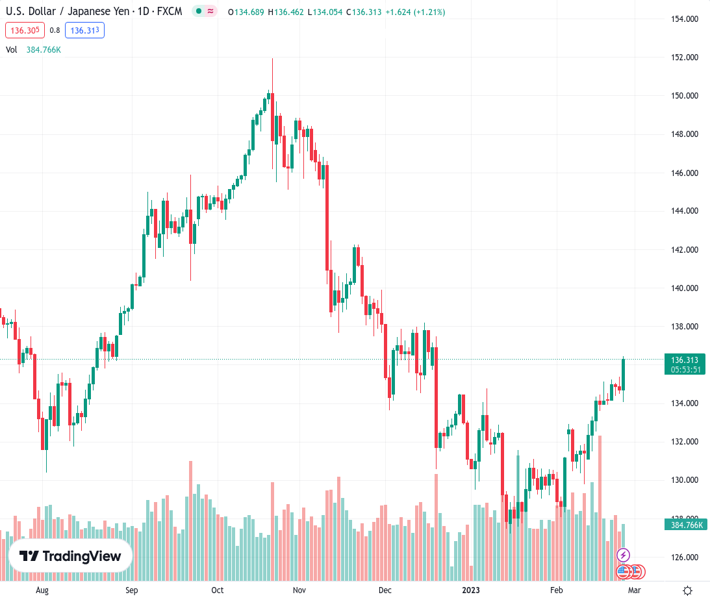
#USDJPY @ 136.317 gathered bullish momentum and climbed above 136.00 on Friday. (Pivot Orderbook analysis)
…
This is a premium post.
[s2If !current_user_can(access_s2member_level4)]Please register for PREMIUM VERSION HERE to read full post below containing analysis. In case of any error or you think you are not able to read the full post below, please email us at support#nehcap.com [lwa][/s2If] [s2If current_user_can(access_s2member_level4)]
- USD/JPY gathered bullish momentum and climbed above 136.00 on Friday.
- The data from the US showed that PCE inflation rose at a stronger pace than expected in January.
- USD/JPY remains on track to post its highest weekly close since early December.
The pair currently trades last at 136.317.
The previous day high was 135.36 while the previous day low was 134.49. The daily 38.2% Fib levels comes at 134.82, expected to provide support. Similarly, the daily 61.8% fib level is at 135.03, expected to provide support.
After having spent the European trading hours near 135.00, USD/JPY gathered bullish momentum in the early American session on Friday and reached its highest level since December 20 at 136.46. As of writing, the pair was trading at 136.30, where it was up 1.2% on a daily basis.
Earlier in the day, incoming Bank of Japan Governor Kazuo Ueda said that a weak Japanese Yen would support exports, inbound tourism and some service sectors. Ueda added that they would need to normalize the monetary policy if inflation makes headway toward 2%. Since the data from Japan revealed that the National Core CPI edged higher to 4.2% on a yearly basis in January from 4% in December, these comments failed to help the Yen gather strength.
In the second half of the day, the US Bureau of Economic Analysis reported that the annual Personal Consumption Expenditures (PCE) Price Index rose to 5.4% in January from 5.3% in December (revised from 5%). Additionally, the Core PCE Price Index, the Fed’s preferred gauge of inflation, rose 0.6% on a monthly basis and lifted the annual rate to 4.7% from 4.6%.
Reflecting the positive impact of hot inflation data on the US Dollar, the US Dollar Index advanced above 105.00 for the first time since early January.
Meanwhile, the benchmark 10-year US Treasury bond yield climbed to 3.95% following Thursday’s slide and pus additional weight on USD/JPY’s shoulders.
Technical Levels: Supports and Resistances
USDJPY currently trading at 136.22 at the time of writing. Pair opened at 134.64 and is trading with a change of 1.17 % .
| Overview | Overview.1 | |
|---|---|---|
| 0 | Today last price | 136.22 |
| 1 | Today Daily Change | 1.58 |
| 2 | Today Daily Change % | 1.17 |
| 3 | Today daily open | 134.64 |
The pair is trading above its 20 Daily moving average @ 132.18, above its 50 Daily moving average @ 131.8 , below its 100 Daily moving average @ 137.25 and below its 200 Daily moving average @ 137.04
| Trends | Trends.1 | |
|---|---|---|
| 0 | Daily SMA20 | 132.18 |
| 1 | Daily SMA50 | 131.80 |
| 2 | Daily SMA100 | 137.25 |
| 3 | Daily SMA200 | 137.04 |
The previous day high was 135.36 while the previous day low was 134.49. The daily 38.2% Fib levels comes at 134.82, expected to provide support. Similarly, the daily 61.8% fib level is at 135.03, expected to provide support.
Note the levels of interest below:
- Pivot support is noted at 134.3, 133.95, 133.42
- Pivot resistance is noted at 135.17, 135.71, 136.05
| Levels | Levels.1 |
|---|---|
| Previous Daily High | 135.36 |
| Previous Daily Low | 134.49 |
| Previous Weekly High | 135.11 |
| Previous Weekly Low | 131.27 |
| Previous Monthly High | 134.78 |
| Previous Monthly Low | 127.22 |
| Daily Fibonacci 38.2% | 134.82 |
| Daily Fibonacci 61.8% | 135.03 |
| Daily Pivot Point S1 | 134.30 |
| Daily Pivot Point S2 | 133.95 |
| Daily Pivot Point S3 | 133.42 |
| Daily Pivot Point R1 | 135.17 |
| Daily Pivot Point R2 | 135.71 |
| Daily Pivot Point R3 | 136.05 |
[/s2If]
Join Our Telegram Group
")


