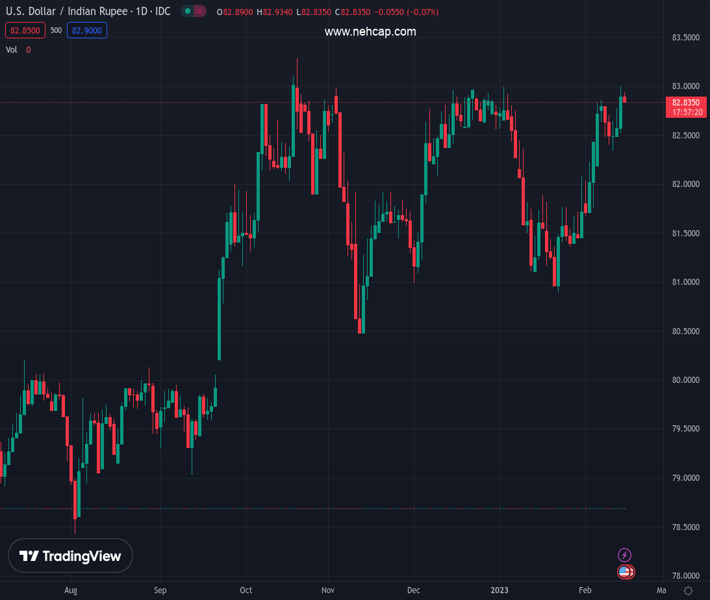
#USDINR @ 82.8810 seesaws around multi-day high as firmer US Dollar jostles with sluggish markets, downbeat Oil price. (Pivot Orderbook analysis)
…
This is a premium post.
[s2If !current_user_can(access_s2member_level4)]Please register for PREMIUM VERSION HERE to read full post below containing analysis. In case of any error or you think you are not able to read the full post below, please email us at support#nehcap.com [lwa][/s2If] [s2If current_user_can(access_s2member_level4)]
- USD/INR seesaws around multi-day high as firmer US Dollar jostles with sluggish markets, downbeat Oil price.
- Fed Officials ignore sticky inflation to defend hawkish bias and propel US Treasury bond yields, USD.
- Upbeat WPI inflation favor RBI rate hike expectations and put a floor under Indian Rupee.
- US data, risk catalysts eyed for fresh impulse.
The pair currently trades last at 82.8810.
The previous day high was 83.0456 while the previous day low was 82.5735. The daily 38.2% Fib levels comes at 82.8652, expected to provide support. Similarly, the daily 61.8% fib level is at 82.7538, expected to provide support.
USD/INR bulls take a breather around the 1.5-month high, flirting with the multi-day-old resistance line near 83.00 by the press time, as markets await more clues to extend the previous day’s run-up.
It’s worth noting that the Indian Rupee (INR) dropped to the lowest levels since early January the previous day after the Federal Reserve (Fed) policymakers ignored unimpressive US inflation numbers to defend their hawkish bias and propel the US Dollar. However, upbeat inflation numbers at home seemed to have probed the USD/INR bulls afterward.
That said, US Consumer Price Index (CPI) rose past market expectations to 6.4% YoY but posted the slowest increase since 2021 while easing below 6.5% prior. More importantly, CPI ex Food & Energy, better known as the Core CPI, grew 5.6% YoY compared to 5.5% market forecasts and the 5.7% previous readings.
On the other hand, India’s WPI Inflation grew more than expected 4.54% to 4.73%, versus 4.95% prior, during January, which in turn justifies the Reserve Bank of India’s (RBI) inflation woes and readiness for further rate increases.
Other than India’s WPI inflation, downbeat Oil prices also weigh on the USD/INR pair, mainly due to the Asian nation’s reliance on energy imports and the record-high deficit. That said, WTI crude oil drops 0.80% intraday to $78.70 while printing a three-day downtrend by the press time.
Talking about the Fed commentary, Dallas Fed President Lorie Logan stated that they must remain prepared to continue rate increases for a longer period than previously anticipated. On the same line was New York Fed President John Williams who noted that the work to control too high inflation is not yet done. Additionally, Philadelphia Fed President Patrick Harker signaled that they are not done (with lifting rates), but they are likely close.
Amid these plays, US 10-year Treasury bond yields retreat to around 3.74%, after rising three basis points (bps) to refresh a six-week high the previous day whereas the two-year counterpart jumped to the highest level since early November 2022 by poking 4.62%, near 4.61% at the latest. Further, S&P 500 Futures trace Wall Street’s downbeat closing to highlight the mildly offbeat mood and help the US Dollar Index (DXY) to extend the post-US CPI run-up.
Moving on, US Retail Sales and Industrial Production details for January, as well as NY Empire State Manufacturing Index for February, should be watched closely to confirm the Fed’s hawkish bias ahead of the next week’s Federal Open Market Committee (FOMC) Minutes.
A daily closing beyond the four-month-old descending resistance line, around 83.00 by the press time, becomes necessary for the USD/INR bulls to keep the reins.
Technical Levels: Supports and Resistances
USDINR currently trading at 82.886 at the time of writing. Pair opened at 82.9169 and is trading with a change of -0.04% % .
| Overview | Overview.1 | |
|---|---|---|
| 0 | Today last price | 82.886 |
| 1 | Today Daily Change | -0.0309 |
| 2 | Today Daily Change % | -0.04% |
| 3 | Today daily open | 82.9169 |
The pair remains strongly bullish on the daily timeframe. It trades above its 20 SMA @ 81.9766, 50 SMA 82.2266, 100 SMA @ 82.0702 and 200 SMA @ 80.5492.
| Trends | Trends.1 | |
|---|---|---|
| 0 | Daily SMA20 | 81.9766 |
| 1 | Daily SMA50 | 82.2266 |
| 2 | Daily SMA100 | 82.0702 |
| 3 | Daily SMA200 | 80.5492 |
The previous day high was 83.0456 while the previous day low was 82.5735. The daily 38.2% Fib levels comes at 82.8652, expected to provide support. Similarly, the daily 61.8% fib level is at 82.7538, expected to provide support.
Note the levels of interest below:
- Pivot support is noted at 82.6451, 82.3733, 82.173
- Pivot resistance is noted at 83.1171, 83.3174, 83.5892
| Levels | Levels.1 |
|---|---|
| Previous Daily High | 83.0456 |
| Previous Daily Low | 82.5735 |
| Previous Weekly High | 82.9399 |
| Previous Weekly Low | 82.1626 |
| Previous Monthly High | 83.0720 |
| Previous Monthly Low | 80.8822 |
| Daily Fibonacci 38.2% | 82.8652 |
| Daily Fibonacci 61.8% | 82.7538 |
| Daily Pivot Point S1 | 82.6451 |
| Daily Pivot Point S2 | 82.3733 |
| Daily Pivot Point S3 | 82.1730 |
| Daily Pivot Point R1 | 83.1171 |
| Daily Pivot Point R2 | 83.3174 |
| Daily Pivot Point R3 | 83.5892 |
[/s2If]
Join Our Telegram Group
")


