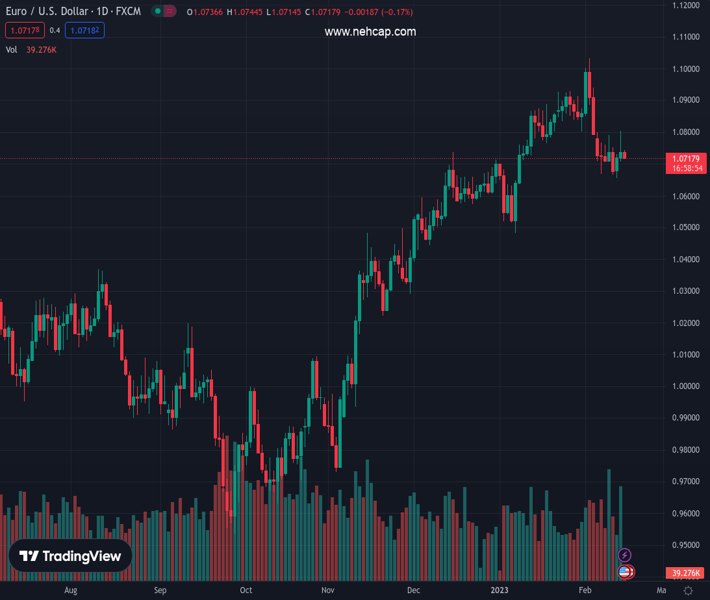
#EURUSD @ 1.07180 prints the first daily loss in three, holds lower ground of late. (Pivot Orderbook analysis)
…
This is a premium post.
[s2If !current_user_can(access_s2member_level4)]Please register for PREMIUM VERSION HERE to read full post below containing analysis. In case of any error or you think you are not able to read the full post below, please email us at support#nehcap.com [lwa][/s2If] [s2If current_user_can(access_s2member_level4)]
- EUR/USD prints the first daily loss in three, holds lower ground of late.
- Fed Officials ignore sticky inflation to defend rate hike bias, underpin yields and US Dollar rebound.
- ECB talks appear less lucrative and so do the Eurozone statistics.
- Dovish bias of ECB’s Lagarde, upbeat US Retail Sales, Industrial Production needed to extend latest weakness.
The pair currently trades last at 1.07180.
The previous day high was 1.0805 while the previous day low was 1.0707. The daily 38.2% Fib levels comes at 1.0767, expected to provide resistance. Similarly, the daily 61.8% fib level is at 1.0744, expected to provide resistance.
EUR/USD slips to 1.0715 as it prints the first daily loss in three during early Wednesday morning in Europe. The Euro pair’s latest losses could be linked to the US Dollar’s broad gains, backed by the risk-off mood and the firmer Treasury bond yields, ahead of the key catalysts scheduled to release from the Eurozone and the US.
It should be noted that the market’s sour sentiment seems taking clues from the hopes of aggressive monetary policies at the key central banks, including the Federal Reserve (Fed), Bank of England (BoE) and the European Central Bank (ECB). Adding strength to the mildly offbeat sentiment are the jitters surrounding the US-China ties amid alleged spying via balloons. While portraying the mood, S&P 500 Futures trace Wall Street’s downbeat closing to highlight the mildly offbeat mood.
Elsewhere, US 10-year Treasury bond yields retreat to around 3.74%, after rising three basis points (bps) to refresh a six-week high the previous day whereas the two-year counterpart jumped to the highest level since early November 2022 by poking 4.62%, near 4.61% at the latest.
The return of the US Treasury bond sellers appears linked to the hawkish Fed talks, as well as the better-than-forecast US Consumer Price Index (CPI) for January, which in turn joined downbeat sentiment to favor the US Dollar Index (DXY).
On the other hand, unimpressive prints of the Eurozone growth numbers joined mixed statements from ECB Officials to weigh on the Euro amid a sluggish trading session ahead of the key data.
Looking ahead, Industrial Production details for the Eurozone and the US will join the US Retail Sales, as well as NY Empire State Manufacturing Index, to decorate the calendar and offer additional clues to the EUR/USD pair traders. However, major attention will be given to ECB President Christine Lagarde’s speech as major of the latest policymakers, including Governing Council members Gabriel Makhlouf and Mario Centeno, appeared hawkish but couldn’t ignore economic fears and remained unimpressive to the Euro bulls.
EUR/USD remains inside a one-week-long megaphone chart formation, a trend-widening pattern between 1.0810 and 1.0655.
Technical Levels: Supports and Resistances
EURUSD currently trading at 1.0718 at the time of writing. Pair opened at 1.0738 and is trading with a change of -0.19% % .
| Overview | Overview.1 | |
|---|---|---|
| 0 | Today last price | 1.0718 |
| 1 | Today Daily Change | -0.0020 |
| 2 | Today Daily Change % | -0.19% |
| 3 | Today daily open | 1.0738 |
The pair is trading below its 20 Daily moving average @ 1.0818, above its 50 Daily moving average @ 1.0716 , above its 100 Daily moving average @ 1.0385 and above its 200 Daily moving average @ 1.0325
| Trends | Trends.1 | |
|---|---|---|
| 0 | Daily SMA20 | 1.0818 |
| 1 | Daily SMA50 | 1.0716 |
| 2 | Daily SMA100 | 1.0385 |
| 3 | Daily SMA200 | 1.0325 |
The previous day high was 1.0805 while the previous day low was 1.0707. The daily 38.2% Fib levels comes at 1.0767, expected to provide resistance. Similarly, the daily 61.8% fib level is at 1.0744, expected to provide resistance.
Note the levels of interest below:
- Pivot support is noted at 1.0695, 1.0652, 1.0597
- Pivot resistance is noted at 1.0793, 1.0848, 1.0891
| Levels | Levels.1 |
|---|---|
| Previous Daily High | 1.0805 |
| Previous Daily Low | 1.0707 |
| Previous Weekly High | 1.0799 |
| Previous Weekly Low | 1.0666 |
| Previous Monthly High | 1.0930 |
| Previous Monthly Low | 1.0483 |
| Daily Fibonacci 38.2% | 1.0767 |
| Daily Fibonacci 61.8% | 1.0744 |
| Daily Pivot Point S1 | 1.0695 |
| Daily Pivot Point S2 | 1.0652 |
| Daily Pivot Point S3 | 1.0597 |
| Daily Pivot Point R1 | 1.0793 |
| Daily Pivot Point R2 | 1.0848 |
| Daily Pivot Point R3 | 1.0891 |
[/s2If]
Join Our Telegram Group
")


