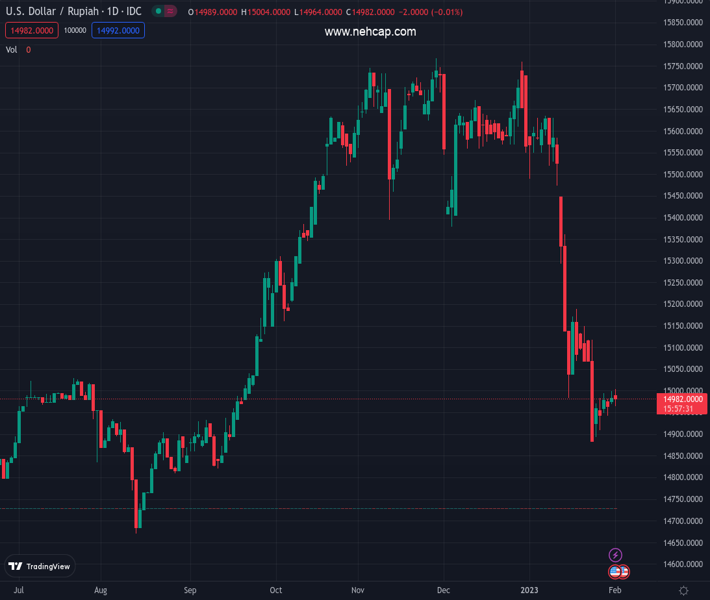
#USDIDR @ 14,983.0 takes offers to refresh intraday low, snaps four-day uptrend. (Pivot Orderbook analysis)
…
This is a premium post.
[s2If !current_user_can(access_s2member_level4)]Please register for PREMIUM VERSION HERE to read full post below containing analysis. In case of any error or you think you are not able to read the full post below, please email us at support#nehcap.com [lwa][/s2If] [s2If current_user_can(access_s2member_level4)]
- USD/IDR takes offers to refresh intraday low, snaps four-day uptrend.
- Indonesia Inflation eases to 5.28% YoY, 0.34% MoM during January.
- Mixed sentiment, sluggish yields and optimism in Asia-Pacific zone favor bears.
- FOMC is the key as 0.25% is priced in but Fed Chair Powell is a hawkish policymaker.
The pair currently trades last at 14983.0.
The previous day high was 15066.2 while the previous day low was 14949.55. The daily 38.2% Fib levels comes at 15021.6397, expected to provide resistance. Similarly, the daily 61.8% fib level is at 14994.1103, expected to provide resistance.
USD/IDR returns to the bear’s table after a four-day absence as it drops to $14,970 while refreshing intraday low during early Wednesday. In doing so, the Rupiah (IDR) ignores downbeat figures of Indonesia’s Inflation while bracing for the Federal Open Market Committee (FOMC) monetary policy meeting.
That said, Indonesia Inflation eased in January to 5.28% YoY and 0.34% MoM, versus 5.51% and 0.66% respective priors. With this, the inflation gauges also remained below the market forecasts of 5.4% yearly and 0.47% monthly figures. Even so, the key statistics remain beyond Bank Indonesia’s (BI) target and underpin the IDR strength.
Other than the upbeat Indonesia data, cautious optimism in the Asia-Pacific region also seems to favor the USD/IDR bears. It’s worth noting that an index of the Asia-Pacific shares outside Japan prints 0.60% intraday gains by the press time while Indonesia’s benchmark IDX Composite rises 0.37% on a day.
On a broader front, the S&P 500 Futures prints mild losses while the US Treasury bond yields remain sluggish and pause the previous day’s pullback. That said, the US Dollar Index (DXY) struggles to reverse Tuesday’s losses around 102.10.
Elsewhere, downbeat US data strengthened the market’s dovish bias surrounding today’s Fed meeting. However, Fed Chair Jerome Powell’s last hawkish stand and readiness to defend the aggressive rate hikes challenge the USD/IDR downside.
That said, US Employment Cost Index (ECI) for the fourth quarter (Q4) eased to 1.0% versus 1.1% market forecasts and 1.2% prior readings. Further, the Conference Board (CB) Consumer Confidence eased to 107.10 in January versus 108.3 prior. It should be noted that no major attention could be given to the US Chicago Purchasing Managers’ Index (PMI) for January which rose to 44.3 versus 41 expected and 44.9 previous readings.
Moving on, US PMIs could entertain USD/IDR traders but major attention will be given to the Fed’s verdict and Chairman Jerome Powell’s press conference.
Also read: Federal Reserve Preview: The Good, the Bad and the Ugly, why the US Dollar would rise
A clear downside break of the one-week-old ascending trend line join s Tuesday’s Doji candlestick to favor USD/IDR bears targeting the monthly low of $14,862.
Technical Levels: Supports and Resistances
USDIDR currently trading at 14978 at the time of writing. Pair opened at 15011.9 and is trading with a change of -0.23% % .
| Overview | Overview.1 | |
|---|---|---|
| 0 | Today last price | 14978 |
| 1 | Today Daily Change | -33.9000 |
| 2 | Today Daily Change % | -0.23% |
| 3 | Today daily open | 15011.9 |
The pair remains strongly bearish on the daily time frame. It trades below the 20 SMA @ 15212.8275, 50 SMA 15447.995, 100 SMA @ 15427.259 and 200 SMA @ 15100.9682.
| Trends | Trends.1 | |
|---|---|---|
| 0 | Daily SMA20 | 15212.8275 |
| 1 | Daily SMA50 | 15447.9950 |
| 2 | Daily SMA100 | 15427.2590 |
| 3 | Daily SMA200 | 15100.9682 |
The previous day high was 15066.2 while the previous day low was 14949.55. The daily 38.2% Fib levels comes at 15021.6397, expected to provide resistance. Similarly, the daily 61.8% fib level is at 14994.1103, expected to provide resistance.
Note the levels of interest below:
- Pivot support is noted at 14952.2333, 14892.5667, 14835.5833
- Pivot resistance is noted at 15068.8833, 15125.8667, 15185.5333
| Levels | Levels.1 |
|---|---|
| Previous Daily High | 15066.2000 |
| Previous Daily Low | 14949.5500 |
| Previous Weekly High | 15121.0000 |
| Previous Weekly Low | 14862.0500 |
| Previous Monthly High | 15700.6000 |
| Previous Monthly Low | 14862.0500 |
| Daily Fibonacci 38.2% | 15021.6397 |
| Daily Fibonacci 61.8% | 14994.1103 |
| Daily Pivot Point S1 | 14952.2333 |
| Daily Pivot Point S2 | 14892.5667 |
| Daily Pivot Point S3 | 14835.5833 |
| Daily Pivot Point R1 | 15068.8833 |
| Daily Pivot Point R2 | 15125.8667 |
| Daily Pivot Point R3 | 15185.5333 |
[/s2If]
Join Our Telegram Group


