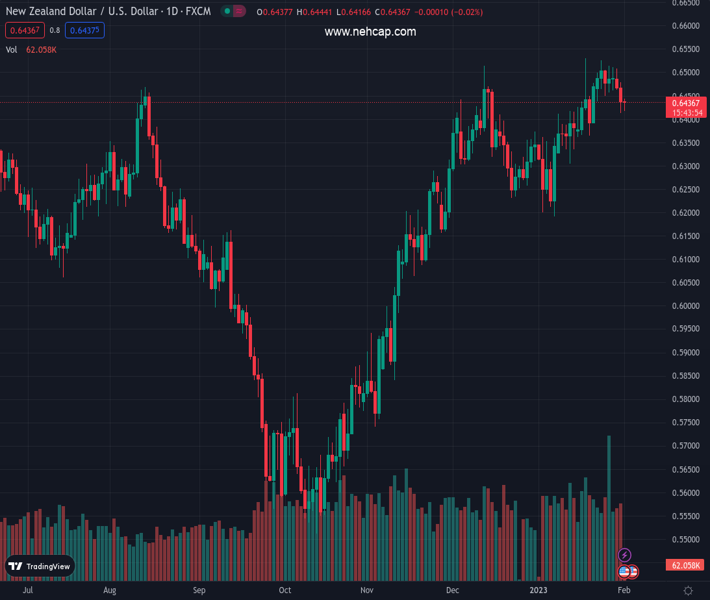
#NZDUSD @ 0.64382 is scaling towards 0.6450 as the USD Index has retreated after a short-lived pullback. (Pivot Orderbook analysis)
…
This is a premium post.
[s2If !current_user_can(access_s2member_level4)]Please register for PREMIUM VERSION HERE to read full post below containing analysis. In case of any error or you think you are not able to read the full post below, please email us at support#nehcap.com [lwa][/s2If] [s2If current_user_can(access_s2member_level4)]
- NZD/USD is scaling towards 0.6450 as the USD Index has retreated after a short-lived pullback.
- Federal Reserve is widely anticipated to announce a 25 bps interest rate hike to 4.50-4.75%.
- Reserve Bank of New Zealand might continue its hawkish stance despite weak Employment data.
- NZD/USD is testing the consolidation breakdown and is likely to display a fresh downside ahead.
The pair currently trades last at 0.64382.
The previous day high was 0.6479 while the previous day low was 0.6412. The daily 38.2% Fib levels comes at 0.6438, expected to provide support. Similarly, the daily 61.8% fib level is at 0.6454, expected to provide resistance.
NZD/USD has stretched its recovery above the critical resistance of 0.6440 in the early European session. The Kiwi asset displayed a recovery move after testing Tuesday’s low around 0.6415 due to subdued performance by the US Dollar Index (DXY). The USD Index is demonstrating topsy-turvy moves in a 101.70-101.80 range and is likely to display a downside break due to less anxiety among investors than usual ahead of the interest rate decision by the Federal Reserve (Fed).
S&P500 futures are failing to square off their losses that emerged in the Asian session, portraying a caution despite overall optimism in the market mood. Widely anticipated expression of further decline in the policy tightening pace by the Federal Reserve is not compelling the market participants to dump risk-sensitive assets. However, emerging United States recession fears due to the expectation of further stretch in the interest rate have shifted investors to the sidelines. The return generated by 10-year US Treasury bonds is hovering around 3.51% after a mild correction.
The Employment Cost Index (Q4) released on Tuesday was trimmed to 1.0% vs. the consensus of 1.1% and the prior release of 1.2%. Easing negotiation power for labor costs is music to the ears for the Federal Reserve, which is working hard to achieve price stability in the United States. Also, the Personal Consumption Expenditure (PCE) price index released last week showed that consumer spending contracted in December Christmas celebrations, which claims that the downside trend in the US Consumer Price Index (CPI) will continue further.
Economists at Goldman Sachs have come up with expectations for dictations by Federal Reserve chair Jerome Powell in February’s monetary policy meeting. They believe that “Since the FOMC last met in December, incoming data on wage growth and inflation have been encouraging, while signals on activity growth have been mixed and at times concerning. This ended up making the case for slowing the pace of rate hikes to 25bp this week quite easy.”
For further guidance, Goldman Sachs expects two additional 25bp hikes in March and May, but fewer might be needed if weak business confidence depresses hiring and investment.
The tight US labor market is losing its luster as firms are ditching the recruitment process due to a bleak economic outlook. Higher interest rates and lower retail demand has already forced the firms to suspend their expansion plans for some time. Also, a few firms are not operating at full capacity, which has trimmed the requirement of hiring fresh talent. This has also trimmed the negotiation power of employees to determine talent acquisition costs.
As per the consensus, the US Automatic Data Processing (ADP) (Jan) Employment data is seen at 170K, significantly lower than the former release of 235K. The declining scale of job additions due to weaker economic projections is going to delight the Federal Reserve as it will trim inflation projections further.
Apart from the Employment data, US ISM Manufacturing PMI (Jan) will be of significant importance. Manufacturing activities are expected to be slowed to 48.0 vs. 48.4 in the prior release as firms are not deploying their entire operating capacity. However, the New Order Index is seen higher at 46.1 vs. the former release of 45.2. An upbeat forward demand might provide some cushion to the USD Index.
The New Zealand Dollar remained extremely volatile in the Asian session due to the release of the Employment data (Q4) and Caixin Manufacturing PMI data. The Employment Change dropped to 0.2% from the expectations of 0.3% and the former release of 1.3%. While the Unemployment Rate has increased to 3.4% from the consensus and the prior release of 3.3%. Apart from that Quarterly Labor cost index has landed at 1.1% lower than the estimates of 1.3% but similar to the prior release of 1.1%.
Steady employment bills and declining labor demand might delight the Reserve Bank of New Zealand (RBNZ), which is working with immense enthusiasm and zeal to achieve price stability. Reserve Bank of New Zealand Governor Adrian Orr might continue hiking interest rates as the inflation rate is still above 7%.
The Caixin manufacturing PMI landed at 49.2 lower than the expectations of 49.5 but higher than the former release of 49.0. It is worth noting that New Zealand is one of the leading trading partners of China and an unimpressive PMI has a vital impact on the New Zealand Dollar.
NZD/USD has sensed selling interest after testing the strength of the consolidation breakdown in the 0.6450-0.6470 range on a four-hour scale. On a broader note, the kiwi asset demonstrated signs of bearish reversal after a Double Top chart pattern around December 13 high at 0.6515. An absence of stellar buying interest while attempting to surpass the 0.6515 resistance triggered selling pressure for the New Zealand Dollar.
The 50-period Exponential Moving Average (EMA) at 0.6460 is acting as a major barricade for the New Zealand Dollar.
Meanwhile, the Relative Strength Index (RSI) (14) has also slipped into the bearish range of 20.00-40.00, which indicates that the downside momentum is active now.
Technical Levels: Supports and Resistances
NZDUSD currently trading at 0.6434 at the time of writing. Pair opened at 0.6465 and is trading with a change of -0.48 % .
| Overview | Overview.1 | |
|---|---|---|
| 0 | Today last price | 0.6434 |
| 1 | Today Daily Change | -0.0031 |
| 2 | Today Daily Change % | -0.4800 |
| 3 | Today daily open | 0.6465 |
The pair remains strongly bullish on the daily timeframe. It trades above its 20 SMA @ 0.6413, 50 SMA 0.6359, 100 SMA @ 0.6093 and 200 SMA @ 0.6192.
| Trends | Trends.1 | |
|---|---|---|
| 0 | Daily SMA20 | 0.6413 |
| 1 | Daily SMA50 | 0.6359 |
| 2 | Daily SMA100 | 0.6093 |
| 3 | Daily SMA200 | 0.6192 |
The previous day high was 0.6479 while the previous day low was 0.6412. The daily 38.2% Fib levels comes at 0.6438, expected to provide support. Similarly, the daily 61.8% fib level is at 0.6454, expected to provide resistance.
Note the levels of interest below:
- Pivot support is noted at 0.6425, 0.6385, 0.6358
- Pivot resistance is noted at 0.6492, 0.6519, 0.6559
| Levels | Levels.1 |
|---|---|
| Previous Daily High | 0.6479 |
| Previous Daily Low | 0.6412 |
| Previous Weekly High | 0.6526 |
| Previous Weekly Low | 0.6437 |
| Previous Monthly High | 0.6531 |
| Previous Monthly Low | 0.6190 |
| Daily Fibonacci 38.2% | 0.6438 |
| Daily Fibonacci 61.8% | 0.6454 |
| Daily Pivot Point S1 | 0.6425 |
| Daily Pivot Point S2 | 0.6385 |
| Daily Pivot Point S3 | 0.6358 |
| Daily Pivot Point R1 | 0.6492 |
| Daily Pivot Point R2 | 0.6519 |
| Daily Pivot Point R3 | 0.6559 |
[/s2If]
Join Our Telegram Group


