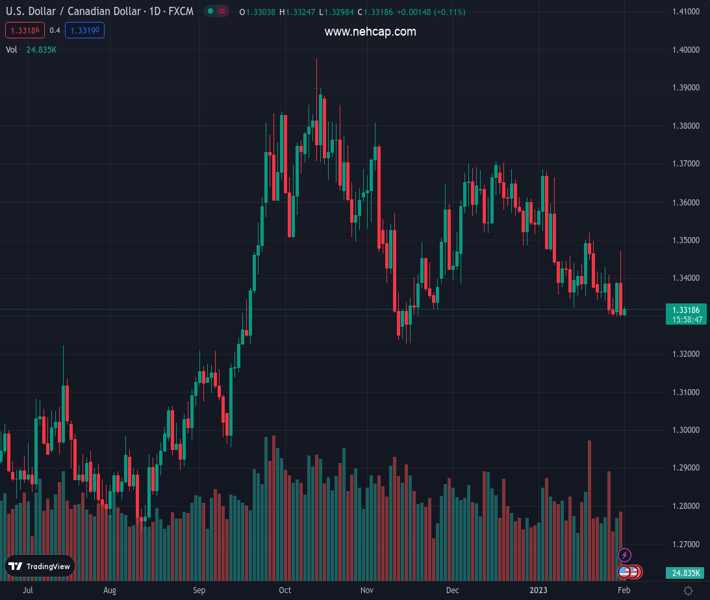
#USDCAD @ 1.33245 licks its wounds after falling the most in a week. (Pivot Orderbook analysis)
…
This is a premium post.
[s2If !current_user_can(access_s2member_level4)]Please register for PREMIUM VERSION HERE to read full post below containing analysis. In case of any error or you think you are not able to read the full post below, please email us at support#nehcap.com [lwa][/s2If] [s2If current_user_can(access_s2member_level4)]
- USD/CAD licks its wounds after falling the most in a week.
- Oil price struggles despite softer US Dollar as markets brace for OPEC+ verdict.
- Softer US data, yields join bearish bias for the Fed to lure Loonie pair sellers.
- Canada GDP appeared unimpressive but PMIs may offer intermediate moves.
The pair currently trades last at 1.33245.
The previous day high was 1.3472 while the previous day low was 1.33. The daily 38.2% Fib levels comes at 1.3365, expected to provide resistance. Similarly, the daily 61.8% fib level is at 1.3406, expected to provide resistance.
USD/CAD remains defensive around 1.3310 amid sluggish markets on early Wednesday, treading water after reversing from a one-week high the previous day.
The Loonie pair’s latest inaction portrays the cautious mood ahead of the Federal Open Market Committee (FOMC) monetary policy meeting. Also challenging the quote is the Oil traders’ anxiety before the Joint Ministerial Monitoring Committee (JMMC) of the Organization of the Petroleum Exporting Countries (OPEC) and allies led by Russia, known collectively as OPEC+.
That said, the WTI crude oil, Canada’s main export earner, grinds higher past $79.00 following a strong reversal from the three-week on Tuesday. It should be noted that Reuters has already turned down the odds of any change in the OPEC+ JMMC’s previous verdict favoring the supply cuts from major producers.
On the other hand, the US Dollar Index (DXY) remains indecisive after reversing from a one-week high as an early signal for the US inflation printed downbeat figures. That said, US Employment Cost Index (ECI) for the fourth quarter (Q4) eased to 1.0% versus 1.1% market forecasts and 1.2% prior readings. Further, the Conference Board (CB) Consumer Confidence eased to 107.10 in January versus 108.3 prior. It should be noted that no major attention could be given to the US Chicago Purchasing Managers’ Index (PMI) for January which rose to 44.3 versus 41 expected and 44.9 previous readings.
At home, Canadian Gross Domestic Product (GDP) for November grew by 0.1% MoM, matching October’s expansion of 0.1% but rose past the market expectation of 0%.
It should be observed that the pre-event cautiousness joins China’s Consecutive sixth below 50.0 print of the Caixin Manufacturing PMI, which in turn probes the Oil price and put a floor under the USD/CAD. Additionally, mildly offered S&P 500 Futures act as an additional challenge for the Loonie pair sellers.
On the contrary, downbeat yields challenge the US Dollar bulls ahead of the key event. The benchmark US 10-year Treasury bond yields remain sluggish near 3.51% and defend the previous day’s pullback.
Looking forward, dovish bias over the Fed joins the likely unimpressive OPEC+ meeting to keep USD/CAD bears hopeful. Also important will be the monthly PMI data for the US and Canada.
Unless providing a daily close beyond the one-month-old descending resistance line, close to 1.3380 by the press time, USD/CAD is on the way to late 2022 low surrounding 1.3225.
Technical Levels: Supports and Resistances
USDCAD currently trading at 1.3314 at the time of writing. Pair opened at 1.3305 and is trading with a change of 0.07% % .
| Overview | Overview.1 | |
|---|---|---|
| 0 | Today last price | 1.3314 |
| 1 | Today Daily Change | 0.0009 |
| 2 | Today Daily Change % | 0.07% |
| 3 | Today daily open | 1.3305 |
The pair is trading below its 20 Daily moving average @ 1.3406, below its 50 Daily moving average @ 1.35 , below its 100 Daily moving average @ 1.353 and above its 200 Daily moving average @ 1.3214
| Trends | Trends.1 | |
|---|---|---|
| 0 | Daily SMA20 | 1.3406 |
| 1 | Daily SMA50 | 1.3500 |
| 2 | Daily SMA100 | 1.3530 |
| 3 | Daily SMA200 | 1.3214 |
The previous day high was 1.3472 while the previous day low was 1.33. The daily 38.2% Fib levels comes at 1.3365, expected to provide resistance. Similarly, the daily 61.8% fib level is at 1.3406, expected to provide resistance.
Note the levels of interest below:
- Pivot support is noted at 1.3246, 1.3187, 1.3074
- Pivot resistance is noted at 1.3418, 1.3531, 1.359
| Levels | Levels.1 |
|---|---|
| Previous Daily High | 1.3472 |
| Previous Daily Low | 1.3300 |
| Previous Weekly High | 1.3428 |
| Previous Weekly Low | 1.3300 |
| Previous Monthly High | 1.3685 |
| Previous Monthly Low | 1.3300 |
| Daily Fibonacci 38.2% | 1.3365 |
| Daily Fibonacci 61.8% | 1.3406 |
| Daily Pivot Point S1 | 1.3246 |
| Daily Pivot Point S2 | 1.3187 |
| Daily Pivot Point S3 | 1.3074 |
| Daily Pivot Point R1 | 1.3418 |
| Daily Pivot Point R2 | 1.3531 |
| Daily Pivot Point R3 | 1.3590 |
[/s2If]
Join Our Telegram Group


