Telegram Twitter
  • CREST
  • NEDEX
    • Download NEDEX
  • HFT-FIX
  • HFT-ECX
  • Contact
  • Our Systems
  • Pricing
  • Reports
    • Returns
    • Latency Arbitrage
    • HFT-FIX
    • HFT-ECX
  • en EN
    • ar AR
    • zh-CN ZH-CN
    • nl NL
    • en EN
    • fr FR
    • de DE
    • it IT
    • ja JA
    • ru RU
    • es ES
    • sv SV
  • Login
Search
Sign in
Welcome! Log into your account
Forgot your password? Get help
woocommerce-placeholder
Password recovery
Recover your password
A password will be e-mailed to you.
NeH Capital
  • CREST
  • NEDEX
    • Download NEDEX
  • HFT-FIX
  • HFT-ECX
  • Contact
  • Our Systems
  • Pricing
  • Reports
    • Returns
    • Latency Arbitrage
    • HFT-FIX
    • HFT-ECX
  • en EN
    • ar AR
    • zh-CN ZH-CN
    • nl NL
    • en EN
    • fr FR
    • de DE
    • it IT
    • ja JA
    • ru RU
    • es ES
    • sv SV
  • Login
Home analysis How To Read A Live Trading Track Record
  • analysis
  • Trading Education

How To Read A Live Trading Track Record

By
-
June 25, 2026
0
8
Facebook
Twitter
Pinterest
WhatsApp
    Trading Education Series: View all 10 NEHCap guides on FX analysis, risk control and trading process.

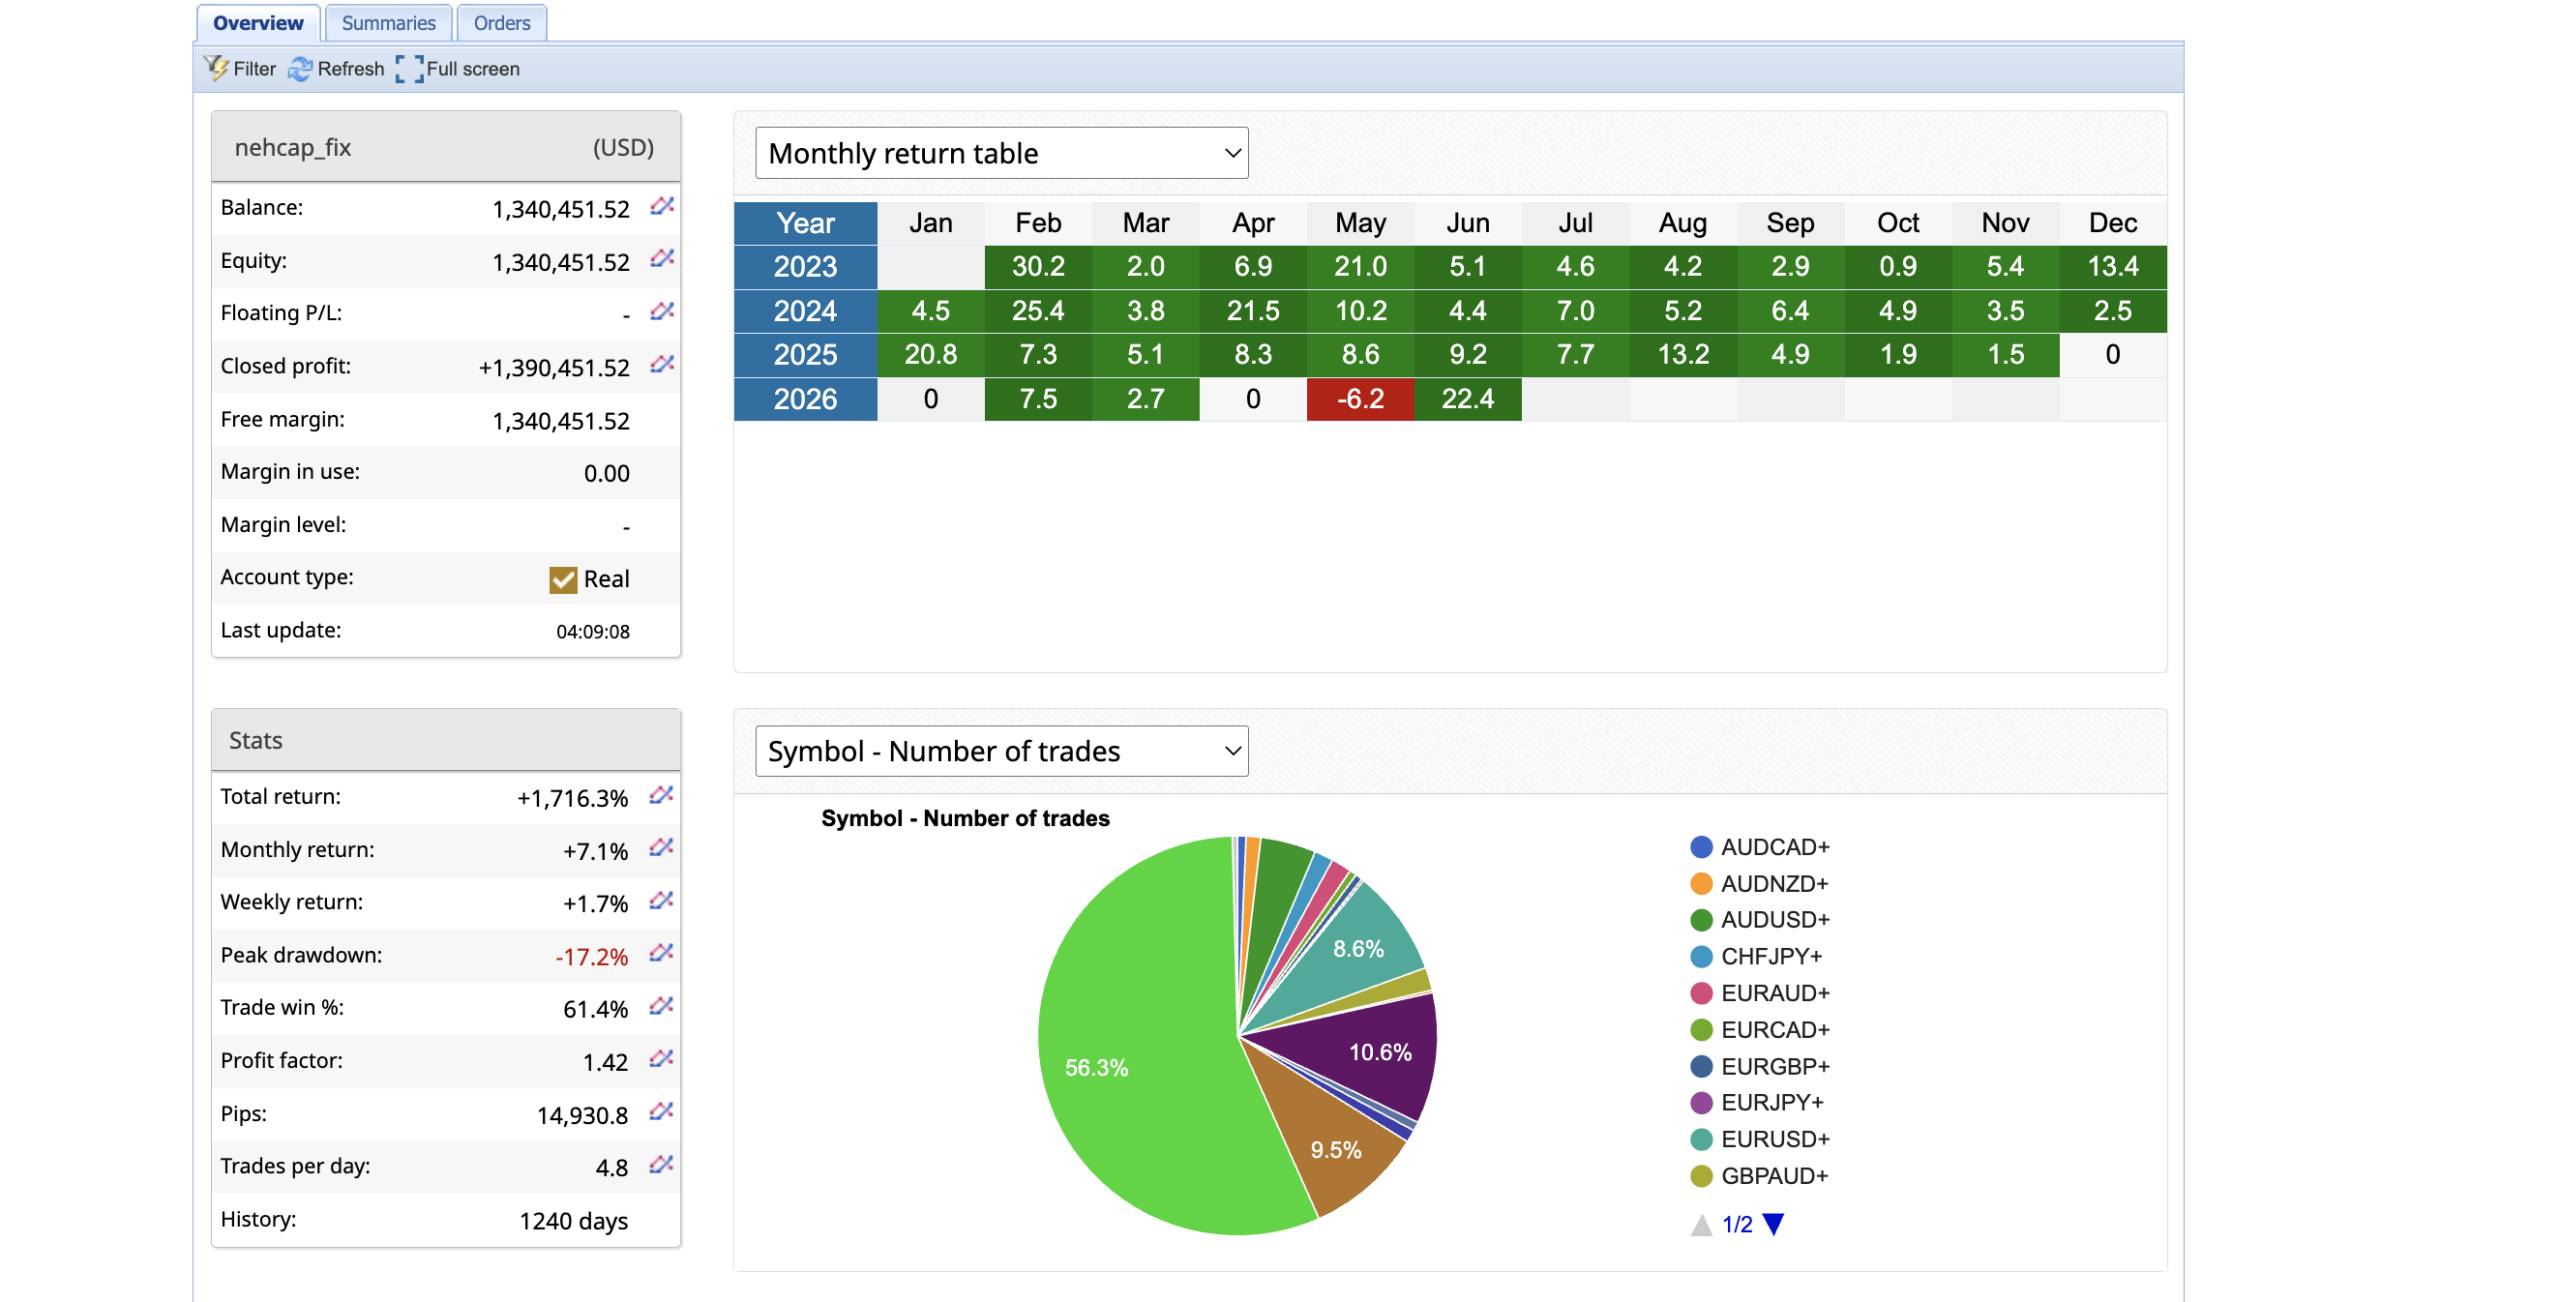
    Live Records Carry More Weight Than Claims

    A live trading track record is one of the most useful ways to assess a trading system because it reflects real execution, broker conditions, spreads, timing and trade management. Backtests can be useful, but live account behaviour is the stronger evidence.

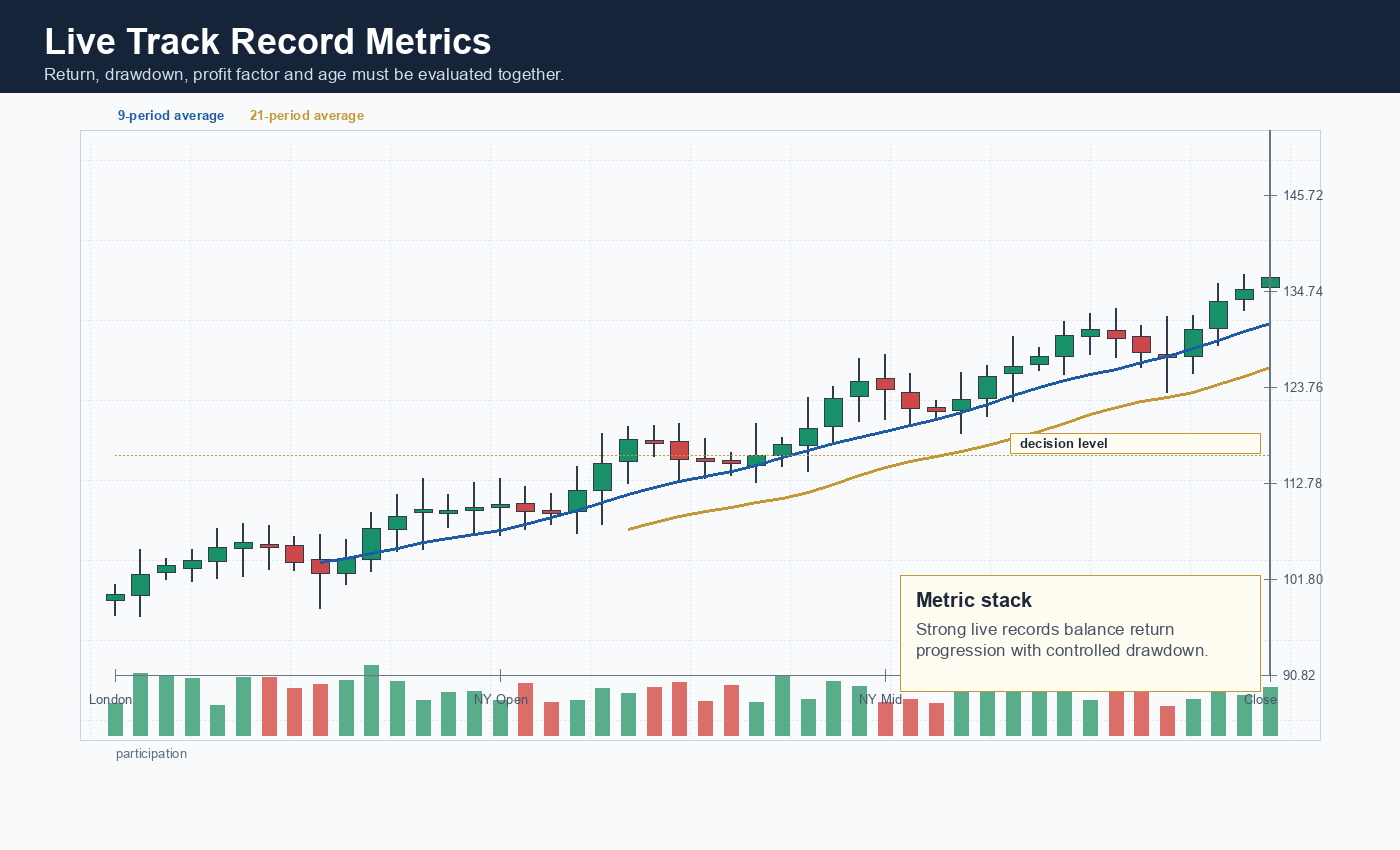
    The correct review process does not focus only on total return. Return must be read together with drawdown, account age, trade frequency, profit factor, symbol exposure and recovery behaviour.

    Live track record dashboard chart showing return drawdown and profit factor context

    Key Metrics To Review

    • Total return: cumulative growth over the account history.
    • Monthly return: recent performance under current market conditions.
    • Drawdown: the depth of decline from peak levels.
    • Profit factor: gross profit relative to gross loss.
    • Trade count: sample size behind the performance.
    • Account age: whether the record has survived multiple market regimes.
    • Symbol concentration: whether returns depend on one instrument.

    Continue the framework: The headline return is only the beginning; the next section examines drawdown and recovery, where the quality of the performance path becomes clearer.

    Member access
    Login or verify email access to continue.

    Forgot password?

    A verification link is sent by email before access is unlocked.

    NEHCap Systems Snapshot

    NEHCap operates three live trading frameworks across high-frequency FX, arbitrage execution and high-speed trend systems:

    • HFT_FIX – FIX-engine high-frequency FX model, with the latest performance snapshot shown here.
    • NEDEX – masked arbitrage framework designed for short-lived pricing inefficiencies; available for MT4, MT5 and FIX API discussion.
    • CREST – high-speed support/resistance trend-burst system; available for MT4, MT5 and FIX API discussion.

    Contact NEHCap or message Telegram: @mqlnehcap / t.me/nehcapmeta.

    HFT_FIX June 2026 live account performance snapshot

    This material is provided for education and market understanding only. It is not personal investment advice, a recommendation to trade, or a guarantee of future performance.

    Previous: Risk Reward Ratio   |   Next: Forex Volatility And ATR
    • TAGS
    • Drawdown
    • FXBlue Performance
    • Live Trading Account
    • Myfxbook Analysis
    • Trading System Performance
    Facebook
    Twitter
    Pinterest
    WhatsApp
      Previous articleRisk Reward Ratio: Why Winning Less Can Still Make Money
      Next articleVolatility Trading: Why Gold, EURUSD, And JPY Pairs Behave Differently

      RELATED ARTICLESMORE FROM AUTHOR

      ATR volatility chart showing expansion and stop planning

      Volatility Trading: Why Gold, EURUSD, And JPY Pairs Behave Differently

      Risk reward and expectancy chart showing positive payoff relationship

      Risk Reward Ratio: Why Winning Less Can Still Make Money

      Clean moving average strategy chart showing simple trend filter

      How To Use Moving Averages Without Overloading The Chart

      Confirmed breakout sequence showing break, retest and continuation

      Breakout Trading: How To Avoid False Breakouts

      Candlestick rejection chart showing wick response near support

      Candlestick Patterns That Actually Matter In Forex

      • CREST
      • NEDEX
        • Download NEDEX
      • HFT-FIX
      • HFT-ECX
      • Contact
      • Our Systems
      • Pricing
      • Reports
        • Returns
        • Latency Arbitrage
        • HFT-FIX
        • HFT-ECX
      ©