Gold price surges, buoyed by a decline in US Treasury yields and optimistic market conditions.
…
This is a premium post.
[s2If !current_user_can(access_s2member_level4)]Please register for FREE REGISTER to read full post below containing analysis. In case of any error or you think you are not able to read the full post below, please email us at support#nehcap.com [lwa][/s2If] [s2If current_user_can(access_s2member_level1)]
- Gold price surges, buoyed by a decline in US Treasury yields and optimistic market conditions.
- Risk-on mood prevails, yet Gold attracts investors, defying typical safe-haven asset trends.
- Market sentiment adjusts to Fed’s cautious stance with expectations of significant rate easing by year-end.
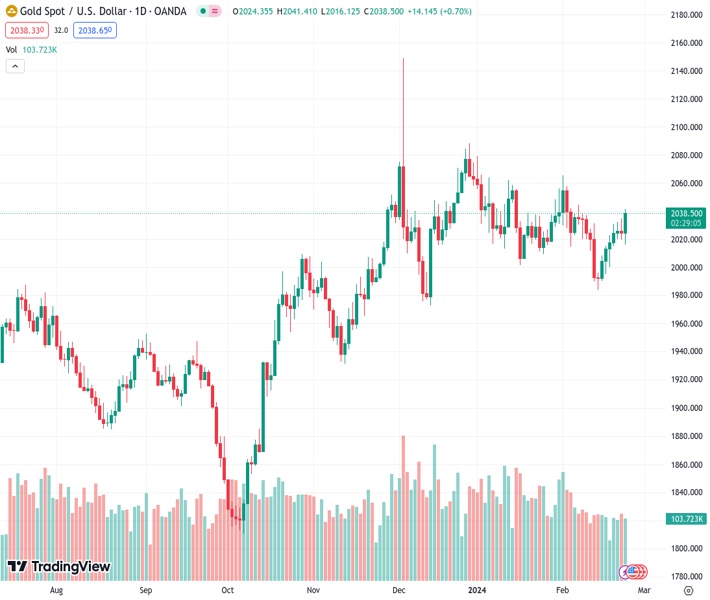
Gold price resumes its weekly uptrend on Friday and is set to finish the week in the green, taking advantage of the fall in US Treasury bond yields amid quiet news flows. Federal Reserve officials continued to cross the wires, led by New York Fed President John Williams, who aligned with his colleagues’ recent comments. The XAU/USD exchanges hands at $2,038, up 0.70%.
The financial markets are in a risk-on mode, which usually translates to “less” appetite for safe-haven assets, but not today as Gold remains underpinned by dropping US Treasury yields. The 10-year benchmark note erased most of its gains, falling three and a half basis points, down to 4.248%. Despite Fed officials delivering a “slightly” hawkish tone recently, this was well received by investors who trimmed bets on Fed interest rate cuts and expect 93 basis points of easing toward the year’s end.
Gold has shifted to a neutral-upwards bias as it hurdles the 50-day Simple Moving Average (SMA) at $2,033.75, opening the door to challenge the $2,050 figure. Once those levels are cleared, up next would be the February 1 high at $2,065.60, ahead of the December 28 high at $2,088.48.
On the flip side, sellers dragging the XAU/USD spot price below the 50-day SMA could pave the way to test the October 27 daily high-turned-support at $2,009.42. A breach of the latter will expose the 100-day SMA at $2,002.05. The next stop would be the December 13 low at $1,973.13, followed by the 200-day SMA at $1,965.86.
[/s2If]
Nehcap Trading Strategies
The NEHCAP currently runs the following trading systems for clients. They can be bought and run on your funds.
The system is trading live: LIVE ACCOUNT TRACKING
Contact Us: Contact
The HFT_FIX can be run free for 2 weeks on any broker with a ECN. Apply for a free trial
Join Our Telegram Group
")


