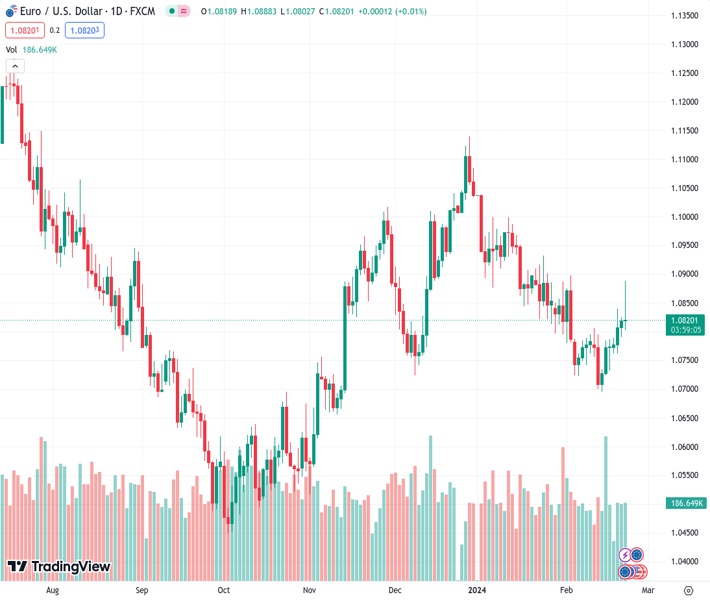
The US Dollar Index showed some gains on Thursday, jumping to 104.10 and then stabilized at 104.00.
…
This is a premium post.
[s2If !current_user_can(access_s2member_level4)]Please register for FREE REGISTER to read full post below containing analysis. In case of any error or you think you are not able to read the full post below, please email us at support#nehcap.com [lwa][/s2If] [s2If current_user_can(access_s2member_level1)]
- The US Dollar Index showed some gains on Thursday, jumping to 104.10 and then stabilized at 104.00.
- February’s S&P PMIs came in mixed, while weekly Jobless Claims came in better than expected.
- Strong labor market figures may push the Fed to remain hawkish.
The US Dollar Index (DXY) saw a slight upswing to 104.10 in Thursday’s session following the release of mixed economic activity data and positive labor market figures but during the American session, it gave up gains at retreated to 104.00.
Meanwhile, the US Federal Reserve continues to adopt a firm approach, showing little interest in reducing interest rates soon and emphasizing the importance of maintaining rates at levels that restrict economic overheating. Market sentiments are increasingly in agreement with this perspective, solidifying the anticipation that any relaxation in monetary policy will be postponed, which may limit the US Dollar’s losses.
The indicators on the DXY daily chart reflect a mixed picture. The Relative Strength Index (RSI) exhibits a flat slope yet remains in positive territory This suggests that although the buying momentum has slowed down recently, the overall uptrend has not been completely undermined.
Concurrently, the Moving Average Convergence Divergence (MACD) displays red bars, which is another indication of rising selling momentum. This denotes a possible shift toward a sideways trading phase or even a slight bearish reversal.
In the larger context, the DXY Index is trading above the 20-day Simple Moving Average (SMA) and 200-day SMA but below the 100-day SMA. This highlights that the bulls maintain some dominance, defying recent bearish pressure. However, the Dollar Index’s position under the 100-day SMA signals a potential short-term trepidation among buyers.
Despite the bulls struggling to gain ground, the overall trend appears to still be in favor of buyers, albeit that increasing bearish signals should not be ignored. Hence, the short-term technical outlook seems to be cautiously bullish, with potential periods of consolidation or minor corrections on the horizon.
[/s2If]
Nehcap Trading Strategies
The NEHCAP currently runs the following trading systems for clients. They can be bought and run on your funds.
The system is trading live: LIVE ACCOUNT TRACKING
Contact Us: Contact
The HFT_FIX can be run free for 2 weeks on any broker with a ECN. Apply for a free trial
Join Our Telegram Group
")


