Gold price threatens to end its streak of gains amid rising US Treasury yields.
…
This is a premium post.
[s2If !current_user_can(access_s2member_level4)]Please register for FREE REGISTER to read full post below containing analysis. In case of any error or you think you are not able to read the full post below, please email us at support#nehcap.com [lwa][/s2If] [s2If current_user_can(access_s2member_level1)]
- Gold price threatens to end its streak of gains amid rising US Treasury yields.
- Market turns cautious ahead of FOMC Minutes and due to recent hawkish Fed indications.
- Adjustments in Fed rate forecasts following inflation reports and bond auctions affect Gold’s appeal.
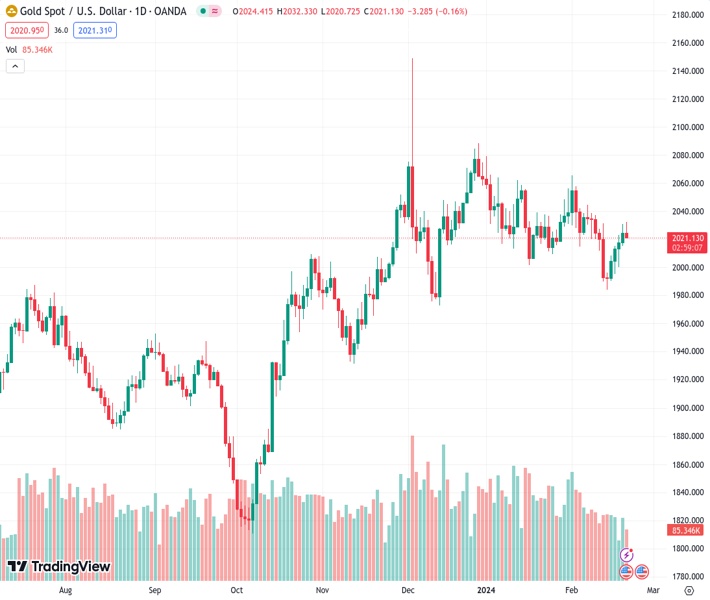
Gold price retreats on Wednesday after registering four days of straight gains as US Treasury bond yields rise in the vicinity of the release of the Minutes from the Federal Reserve’s (Fed) monetary policy meeting in January. Global equities portray a risk-off environment, while US Treasury bond yields resume to the upside amid speculation that the Minutes could reinforce the “hawkish hold” delivered by Fed Chairman Jerome Powell and his colleagues. At the time of writing, the XAU/USD exchanges hands at $2,022.51, down 0.07%.
Traders are eyeing the release of the Federal Open Market Committee (FOMC) Minutes. Fed officials crossed the newswires, expressing that the US central bank would begin to ease monetary policy toward the second half of 2024. However, on the consumer and producer side, January’s inflation data could cause policymakers to refrain from slashing rates as prices escalated above the 3% threshold.
That triggered a repricing on Fed rate cut expectations as shown by the Chicago Board of Trade (CBOT) data, with traders expecting the Federal Funds Rate (FFR) would be at 4.55% by the end of 2024.
Recently, a US 20-year bond auction triggered a jump in US Treasury yields, with the 10-year note yield up five basis points to 4.327%, a headwind for Gold prices.
Gold is trading range-bound though tilted to the downside as the yellow metal has achieved a successive series of lower highs and lows. Stir resistance at the 50-day Simple Moving Average (SMA) at $2,033.54 might cap XAU/USD’s upside, but if cleared, that would pave the way to test the $2,050.00 figure. Upside risks lie at $2,065.60, the February 1 high.
On the flip side, if sellers step in and push prices below the $2,000 figure, that will expose the 100-day SMA at $2,002.05. The next stop would be the December 13 low at $1,973.13, followed by the 200-day SMA at $1,965.86.
[/s2If]
Nehcap Trading Strategies
The NEHCAP currently runs the following trading systems for clients. They can be bought and run on your funds.
The system is trading live: LIVE ACCOUNT TRACKING
Contact Us: Contact
The HFT_FIX can be run free for 2 weeks on any broker with a ECN. Apply for a free trial
Join Our Telegram Group
")


