Gold price extends upside amid increasing geopolitical uncertainty.
…
This is a premium post.
[s2If !current_user_can(access_s2member_level4)]Please register for FREE REGISTER to read full post below containing analysis. In case of any error or you think you are not able to read the full post below, please email us at support#nehcap.com [lwa][/s2If] [s2If current_user_can(access_s2member_level1)]
- Gold price extends upside amid increasing geopolitical uncertainty.
- The US Dollar remains under presssure ahead of the publication of the FOMC minutes.
- Fed’s Goolsbee said higher interest rates for a longer period can impact labor market conditions.
Gold price (XAU/USD) extends its winning spell to a fifth day on Wednesday amid the Red Sea crisis. Also, Chicago Federal Reserve (Fed) Bank President Austan Goolsbee identifies the consequences of keeping interest rates higher for longer on the United States labor market.
While most Fed policymakers say that resilient economic indicators such as Retail Sales and Employment data have bought time to discuss more on rate cuts as these could flare up price pressures again, Chicago Fed Bank President Austan Goolsbee warned that high rates for an extended period could impact the employment side of the Fed’s dual mandate. The Fed’s dual mandate is based on achieving full employment and inflation staying at around 2%. Goolsbee and other Fed policymakers said that inflation is on track to the central bank’s target of 2% despite the acceleration seen in January.
Meanwhile, investors await the publication of the Federal Open Market Committee (FOMC) minutes for January’s monetary policy meeting. The release will likely provide more cues about when the Fed will start reducing interest rates.
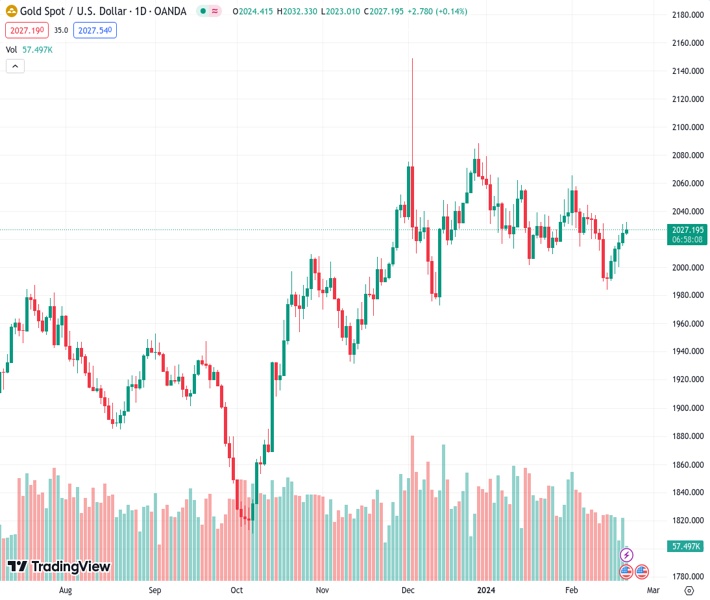
Gold price extends its winning streak for a fifth trading session but struggles to climb above its eight-day high of around $2,031 seen on Tuesday. On a daily time frame, the price is approaching the downward-sloping border of the Symmetrical Triangle chart pattern, which is plotted from December 28’s high at $2,088. The upward-sloping border of the aforementioned chart pattern is placed from December 13’s low at $1,973.
The triangle could break out in either direction. However, the odds marginally favor a move in the direction of the trend before the formation of the triangle – in this case up. A decisive break above or below the triangle boundary lines would indicate a breakout is underway.
The 14-period Relative Strength Index (RSI) has returned to the 40.00-60.00 range quickly after testing territory below 40.00, indicating a bullish reversal.
[/s2If]
Nehcap Trading Strategies
The NEHCAP currently runs the following trading systems for clients. They can be bought and run on your funds.
The system is trading live: LIVE ACCOUNT TRACKING
Contact Us: Contact
The HFT_FIX can be run free for 2 weeks on any broker with a ECN. Apply for a free trial
Join Our Telegram Group
")


