Gold reaches $2,028.44, climbing for the fourth day on China’s rate moves and US inflation figures.
…
This is a premium post.
[s2If !current_user_can(access_s2member_level4)]Please register for FREE REGISTER to read full post below containing analysis. In case of any error or you think you are not able to read the full post below, please email us at support#nehcap.com [lwa][/s2If] [s2If current_user_can(access_s2member_level1)]
- Gold reaches $2,028.44, climbing for the fourth day on China’s rate moves and US inflation figures.
- US Treasury yields fall, showing market caution and adjusted expectations for Fed rate cuts amid inflation.
- Market anticipates FOMC minutes for clues on Fed’s policy stance, bolstering Gold as an uncertainty hedge.
Gold price rallied for the fourth straight day during the mid-North American session as traders from the United States (US) got back to their desks and digested the latest economic news. News that China lowered interest rates sponsored Gold’s leg-up alongside the drop in US Treasury bond yields.
Meanwhile, last week’s data from the US, with the Consumer Price Index (CPI) and the Producer Price Index (PPI) smashing estimates, sounded alarms that inflation remains stickier than expected. The XAU/USD trades at $2,028.44, up 0.52%.
Trading resumed in the US on Tuesday after Monday’s Presidents’ Day holiday. US Treasury bond yields edged lower as depicted by the 10-year note yield down four basis points to 4.256%. This is despite investors adopting a cautious stance on the US Federal Reserve (Fed) as data from the Chicago Board of Trade (CBOT) expects the Fed to lower rates by 102 basis points in 2024, less than the 180 bps estimated in mid-January.
Nevertheless, the Greenback (USD) is treading water amid the lack of economic data on the US docket. Traders await the release of the last Federal Open Market Committee (FOMC) Meeting Minutes.
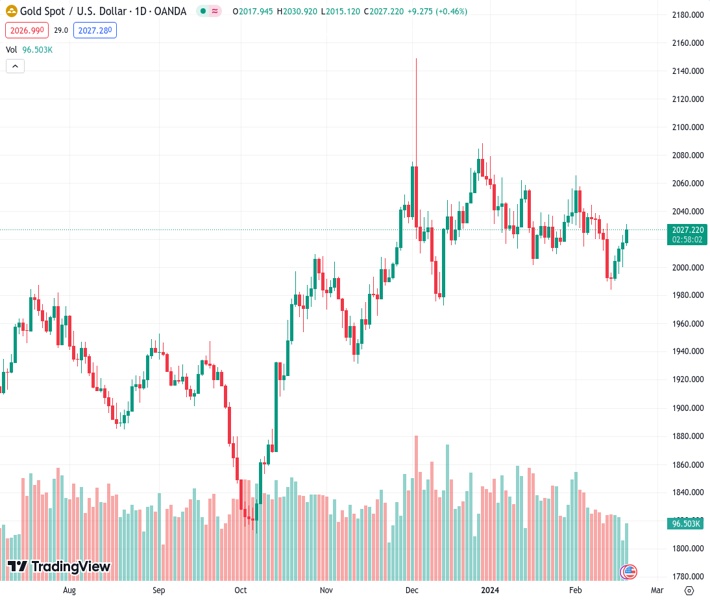
Gold´s daily chart portrays the non-yielding metal as neutral to downwardly biased despite staying above the 200-day Simple Moving Average (SMA) at $1,965.46 and extending its gains toward the 50-day SMA at $2,033.69. A breach of the latter will expose $2,050 ahead of the latest cycle high at $2,065.60.
On the flip side, if sellers step in and push prices below the $2,000 figure, that will expose the 100-day SMA at $1,998. The next stop would be the December 13 low at $1,973.13, followed by the 200-day SMA at $1,965.47.
[/s2If]
Nehcap Trading Strategies
The NEHCAP currently runs the following trading systems for clients. They can be bought and run on your funds.
The system is trading live: LIVE ACCOUNT TRACKING
Contact Us: Contact
The HFT_FIX can be run free for 2 weeks on any broker with a ECN. Apply for a free trial
Join Our Telegram Group
")


