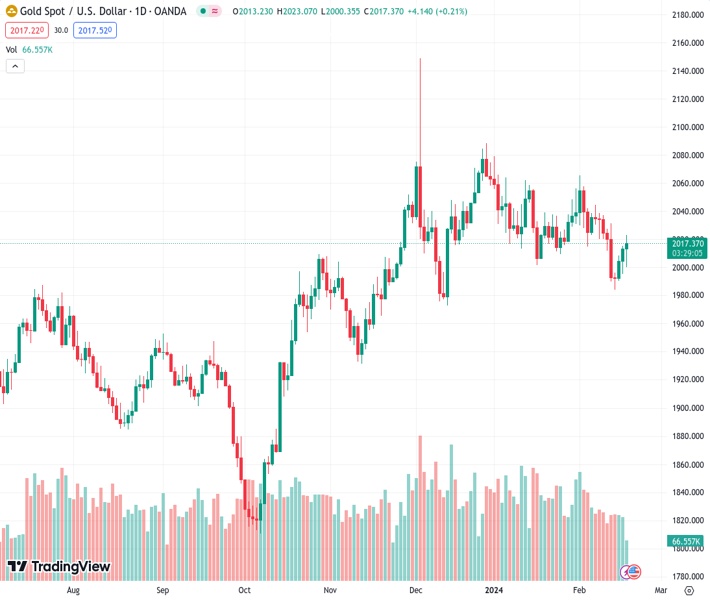
Gold climbs to $2016.30, driven by US inflation surpassing forecasts, signaling ongoing price pressure.
…
This is a premium post.
[s2If !current_user_can(access_s2member_level4)]Please register for FREE REGISTER to read full post below containing analysis. In case of any error or you think you are not able to read the full post below, please email us at support#nehcap.com [lwa][/s2If] [s2If current_user_can(access_s2member_level1)]
- Gold climbs to $2016.30, driven by US inflation surpassing forecasts, signaling ongoing price pressure.
- The diminished likelihood of imminent Fed rate cuts enhances Gold’s allure as the USD has weakened since last Tuesday.
- The decline in US Treasury and real yields underpin Gold’s surge with a rising TIPS yield reflecting higher safe-haven demand.
Gold price extended its gains for three consecutive days after last week’s economic data from the United States (US) revealed that inflation remains above the US Federal Reserve’s (Fed) target. The Consumer Price Index (CPI) and the Producer Price Index (PPI) in January exceeded the consensus, catching traders off guard, which trimmed the odds for a Fed rate cut in March and May. That sponsored a leg-up in the Greenback (USD), which has remained on the defensive since last Tuesday. The XAU/USD exchanges hands at $2016.30.
Traders seeking protection turned to the yellow metal following the latest inflation reports. Additionally, the fall in US Treasury bond yields, particularly the 10-year note that hit a year-to-date (YTD) high of 4.332%, retraced four basis points to 4.293%. Consequently, real yields, which correlate negatively with Gold prices, fell from around 2.04% reached on Wednesday to 1.950%, as reflected by the yield on the US 10-year Treasury Inflation-Protected Securities (TIPS) yield.
Gold´s daily chart portrays the non-yielding metal as neutral to downwardly biased despite staying above the 200-day Simple Moving Average (SMA) at $1,965.46. If buyers would like to regain control, they must challenge the 50-day SMA at $2,032.71. Once cleared, the next stop would be $2,050, ahead of the latest cycle high at $2,065.60.
On the flip side, if sellers step in and push prices below the $2,000 figure, that will expose the 100-day SMA at $1,998. The next stop would be the December 13 low at $1,973.13, followed by the 200-day SMA at $1,965.47.
[/s2If]
Nehcap Trading Strategies
The NEHCAP currently runs the following trading systems for clients. They can be bought and run on your funds.
The system is trading live: LIVE ACCOUNT TRACKING
Contact Us: Contact
The HFT_FIX can be run free for 2 weeks on any broker with a ECN. Apply for a free trial
Join Our Telegram Group
")


