WTI price corrected after registering gains for two successive sessions. (Pivot Orderbook analysis)
…
This is a premium post.
[s2If !current_user_can(access_s2member_level4)]Please register for FREE REGISTER to read full post below containing analysis. In case of any error or you think you are not able to read the full post below, please email us at support#nehcap.com [lwa][/s2If] [s2If current_user_can(access_s2member_level1)]
- WTI price corrected after registering gains for two successive sessions.
- Crude oil prices depreciate amid expectations that the Fed will maintain its current interest rate.
- Israel has signaled the potential for additional military operations in the southern city of Gaza.
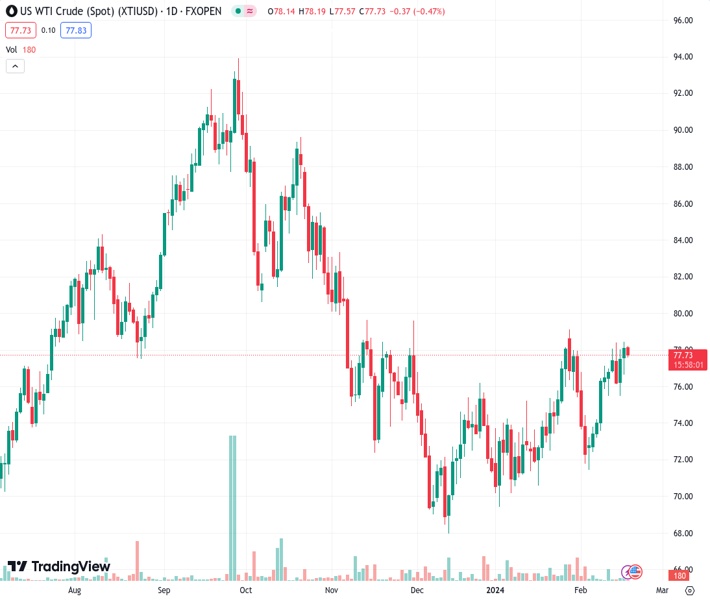
The pair currently trades last at 77.81.
The previous day high was 78.47 while the previous day low was 76.63. The daily 38.2% Fib levels comes at 77.76, expected to provide support. Similarly, the daily 61.8% fib level is at 77.33, expected to provide support.
The West Texas Intermediate (WTI) oil price retraces its recent gains, possibly due to a technical correction, amid subdued trading activity due to the Presidents’ Day holiday in the United States. WTI price dips lower to around $77.80 per barrel during Asian trading hours on Monday. Additionally, market participants are expected to closely monitor demand conditions in China after returning from the week-long holiday.
Crude oil prices encounter challenges amid expectations that the Federal Reserve (Fed) will maintain its current interest rate, following the previous week of complex data. Higher consumer prices coupled with declining retail sales have reinforced the market sentiment that the Fed will abstain from rate cuts in both March and May. The CME FedWatch Tool indicates roughly a 52% probability of a 25 basis points (bps) rate cut in June.
Geopolitical tensions persist in the Middle East following an Israeli military raid on Gaza’s second-largest hospital, causing it to cease functioning according to the United Nations (UN) public health agency. Israel has indicated the possibility of further military action in Gaza’s southern city. Additionally, Iran-led Houthi fighters have attacked an India-bound oil vessel.
The International Energy Agency (IEA) revised its global oil demand growth forecast for 2024 downwards in its latest monthly oil market report. The slowdown in global oil demand growth is partly attributed to developments in China.
The report highlights a tightening of oil market balances in January, primarily due to supply disruptions in the United States and Canada. Despite ongoing production cuts by OPEC+ nations, the IEA anticipates a modest increase in inventories in the first quarter of the year.
Technical Levels: Supports and Resistances
XTIUSD currently trading at 77.81 at the time of writing. Pair opened at 78.21 and is trading with a change of -0.51 % .
| Overview | Overview.1 | |
|---|---|---|
| 0 | Today last price | 77.81 |
| 1 | Today Daily Change | -0.40 |
| 2 | Today Daily Change % | -0.51 |
| 3 | Today daily open | 78.21 |
The pair remains strongly bullish on the daily timeframe. It trades above its 20 SMA @ 75.81, 50 SMA 73.85, 100 SMA @ 76.91 and 200 SMA @ 77.45.
| Trends | Trends.1 | |
|---|---|---|
| 0 | Daily SMA20 | 75.81 |
| 1 | Daily SMA50 | 73.85 |
| 2 | Daily SMA100 | 76.91 |
| 3 | Daily SMA200 | 77.45 |
The previous day high was 78.47 while the previous day low was 76.63. The daily 38.2% Fib levels comes at 77.76, expected to provide support. Similarly, the daily 61.8% fib level is at 77.33, expected to provide support.
Note the levels of interest below:
- Pivot support is noted at 77.07, 75.93, 75.24
- Pivot resistance is noted at 78.91, 79.6, 80.74
| Levels | Levels.1 |
|---|---|
| Previous Daily High | 78.47 |
| Previous Daily Low | 76.63 |
| Previous Weekly High | 78.47 |
| Previous Weekly Low | 75.51 |
| Previous Monthly High | 79.19 |
| Previous Monthly Low | 69.41 |
| Daily Fibonacci 38.2% | 77.76 |
| Daily Fibonacci 61.8% | 77.33 |
| Daily Pivot Point S1 | 77.07 |
| Daily Pivot Point S2 | 75.93 |
| Daily Pivot Point S3 | 75.24 |
| Daily Pivot Point R1 | 78.91 |
| Daily Pivot Point R2 | 79.60 |
| Daily Pivot Point R3 | 80.74 |
[/s2If]
Nehcap Trading Strategies
The NEHCAP currently runs the following trading systems for clients. They can be bought and run on your funds.
The system is trading live: LIVE ACCOUNT TRACKING
Contact Us: Contact
The HFT_FIX can be run free for 2 weeks on any broker with a ECN. Apply for a free trial
Join Our Telegram Group
")


