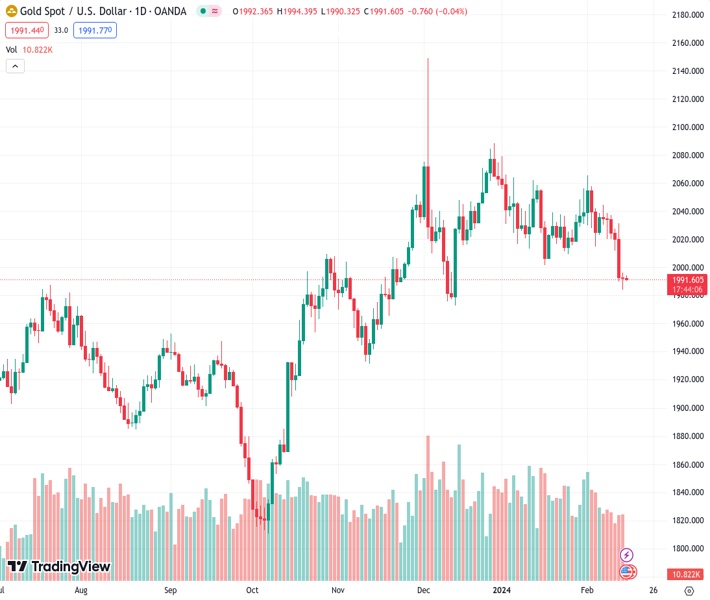
Gold price remains confined in a range just above a two-month low touched on Wednesday.
…
This is a premium post.
[s2If !current_user_can(access_s2member_level4)]Please register for FREE REGISTER to read full post below containing analysis. In case of any error or you think you are not able to read the full post below, please email us at support#nehcap.com [lwa][/s2If] [s2If current_user_can(access_s2member_level1)]
- Gold price remains confined in a range just above a two-month low touched on Wednesday.
- Delayed Fed rate cut bets underpin the USD and act as a headwind for the non-yielding metal.
- Geopolitical tensions in the Middle East help to limit the downside for the safe-haven XAU/USD.
Gold price (XAU/USD) extends its sideways consolidative price move during the Asian session on Thursday and is currently placed just above a two-month low touched the previous day. The hotter-than-expected US inflation data released on Tuesday pushed back expectations for the first interest rate cut by the Federal Reserve (Fed) to the middle of the year and continues to act as a headwind for the non-yielding yellow metal. Meanwhile, hawkish Fed expectations assist the US Dollar (USD) to stall the overnight pullback from its highest level since November 14 and is seen as another factor undermining the commodity.
That said, a further decline in the US Treasury bond yields holds back the USD bulls from placing fresh bets. This, along with the risk of a further escalation of geopolitical tensions, helps limit the downside for the safe-haven Gold price. Meanwhile, the lack of meaningful buying interest and the post-US CPI breakdown through a short-term trading range suggests that the path of least resistance for the XAU/USD remains to the downside. Hence, any attempted recovery might be seen as a selling opportunity and runs the risk of fizzling out rather quickly as traders now look to the US macroeconomic data for a fresh impetus.
From a technical perspective, bearish traders need to wait for acceptance below the 100-day Simple Moving Average (SMA) before positioning for any further losses. Given that oscillators on the daily chart are holding deep in the negative territory, the Gold price might then accelerate the fall towards the very important 200-day SMA support, currently pegged near the $1,965 area. A convincing break below the latter should pave the way for a further depreciating move towards an intermediate support near the $1,952-1,950 zone en route to the November 2023 low, around the $1,932-1,931 region.
On the flip side, any attempted recovery beyond the $2,000 mark now seems to confront stiff resistance near the $2,011-2,012 area. That said, some follow-through buying, leading to a subsequent strength beyond the $2,015 level, might trigger a short-covering rally and lift the Gold price to the 50-day SMA, currently around the $2,030 region. The latter should act as a key pivotal point, which if cleared decisively will set the stage for additional gains beyond the $2,044-2,045 intermediate hurdle, towards the $2,065 supply zone.
[/s2If]
Nehcap Trading Strategies
The NEHCAP currently runs the following trading systems for clients. They can be bought and run on your funds.
The system is trading live: LIVE ACCOUNT TRACKING
Contact Us: Contact
The HFT_FIX can be run free for 2 weeks on any broker with a ECN. Apply for a free trial
Join Our Telegram Group
")


