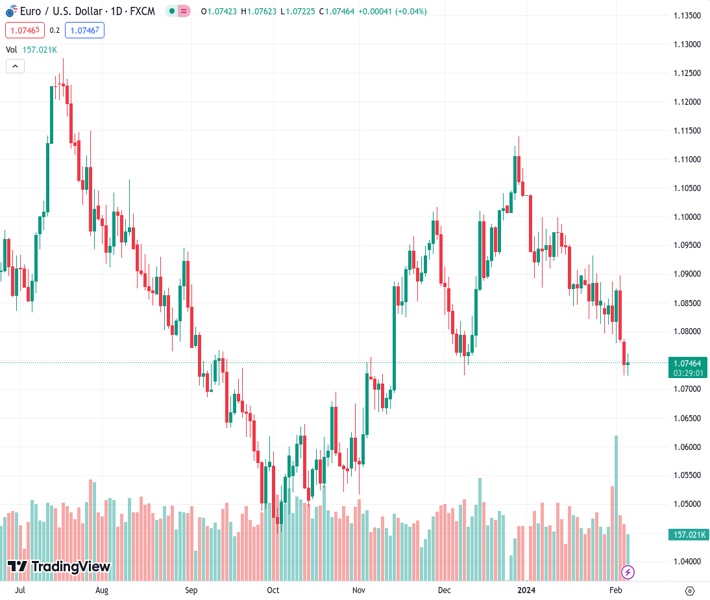
The DXY declined to 104.20 on Tuesday.
…
This is a premium post.
[s2If !current_user_can(access_s2member_level4)]Please register for FREE REGISTER to read full post below containing analysis. In case of any error or you think you are not able to read the full post below, please email us at support#nehcap.com [lwa][/s2If] [s2If current_user_can(access_s2member_level1)]
- The DXY declined to 104.20 on Tuesday.
- The US service sector continues to show robustness, making markets disregard an interest rate cut in March.
- US Treasury yields continue to rise, boosting the Greenback.
The US Dollar (USD) Index, currently trading at 104.20, has been on a downward trend due to investors cashing in their profits alongside the impact of statements from Loretta Mester, the president of the Federal Reserve Bank of Cleveland. Mester warned about the risks of doing too much in terms of tight monetary policy and how it could affect the labor market.
The US Federal Reserve’s hawkish hold, justified by a robust jobs report and continuous strong growth in Q1, made expectations for Federal Reserve (Fed) rate cuts begin to wane. This has favored the Greenback in the last few sessions. Several other Fed officials will be on the wires during the week, and they may dictate the pace of the USD as markets await fresh economic reports.
The indicators on the daily chart are reflecting a short-term shift in momentum toward the sellers, yet the long-term trend still seemingly remains in favor of the bulls. Despite a negative slope, the Relative Strength Index (RSI) is holding onto positive territory, suggesting a pullback or period of consolidation instead of a major trend reversal.
The flat green bars in the Moving Average Convergence Divergence (MACD) indicate potential indecision in the market where the momentum could easily shift in favor of buyers with the right catalyst. However, this flat-lining action in the MACD may also signify exhaustion from buyers, hinting that bears might soon step in to take control.
Given the index position with relation to its Simple Moving Averages (SMAs), the bulls, although weakened recently due to profit-booking, seem to have a major say in the broader trend. The DXY is trading above the 100 and 200-day SMAs, suggesting an overall bullish bias in the longer-term market sentiment even though it slipped underneath the 20-day SMA.
[/s2If]
Nehcap Trading Strategies
The NEHCAP currently runs the following trading systems for clients. They can be bought and run on your funds.
The system is trading live: LIVE ACCOUNT TRACKING
Contact Us: Contact
The HFT_FIX can be run free for 2 weeks on any broker with a ECN. Apply for a free trial
Join Our Telegram Group
")


