Gold price awaits Fed policy and employment data for directional steer
…
This is a premium post.
[s2If !current_user_can(access_s2member_level4)]Please register for FREE REGISTER to read full post below containing analysis. In case of any error or you think you are not able to read the full post below, please email us at support#nehcap.com [lwa][/s2If] [s2If current_user_can(access_s2member_level1)]
Gold price (XAU/USD) remains sideways as investors await the Federal Reserve’s (Fed) first monetary policy of 2024 and the ADP Employment Change data for January. The Fed is expected to deliver a steady interest rate decision for the fourth time in a row. Investors will keenly focus on the bank’s guidance – future expectation – for interest rates, and that will probably direct action in the FX domain.
Amid easing price pressures, further quantitative tightening is not expected from the Fed, therefore, market participants will focus on “when and at what pace” the central bank will start reducing interest rates. Investors are anticipating that the Fed will commence the rate-reduction process from May.
Previous Fed meeting guidance was for 75 basis points (bps) of cuts in interest rates in 2024. The market has been focusing on expectations for early cuts, however, comments from individual policymakers have been advising for keeping interest rates elevated at least for the first-half of the year – until they become confident that the underlying inflation rate will return to the Fed’s 2% target in a timely manner.
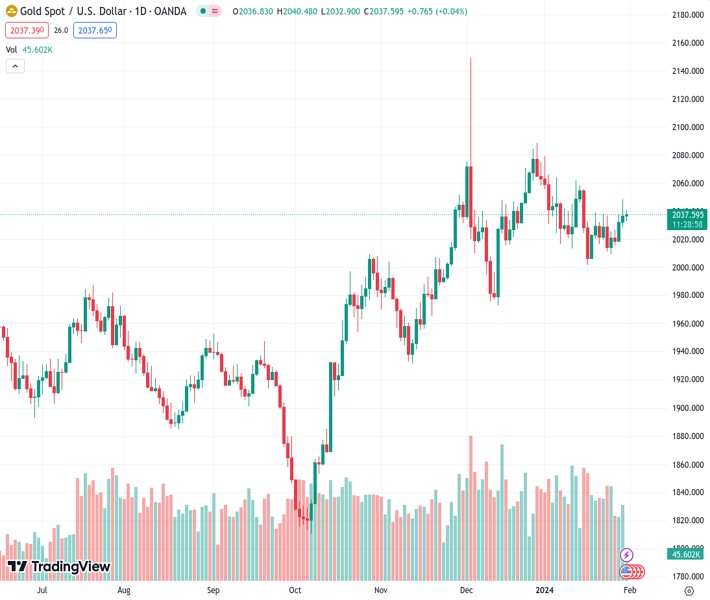
Gold price trades inside Tuesday’s trading range as investors patiently await the Fed policy decision for fresh guidance. The broader trend for Gold price is bullish. The precious metal is forming a Symmetrical Triangle chart pattern on the daily chart. This suggests a probable eventual breakout in the direction of dominant uptrend, although this type of triangle can break in any direction.
Near-term demand is strong as the asset is auctioning above the 20-day Exponential Moving Average (EMA), which trades around $2,030.
Momentum is still weak as the 14-period Relative Strength Index (RSI) oscillates in the 40.00-60.00 range.
[/s2If]
Nehcap Trading Strategies
The NEHCAP currently runs the following trading systems for clients. They can be bought and run on your funds.
The system is trading live: LIVE ACCOUNT TRACKING
Contact Us: Contact
The HFT_FIX can be run free for 2 weeks on any broker with a ECN. Apply for a free trial
Join Our Telegram Group
")


