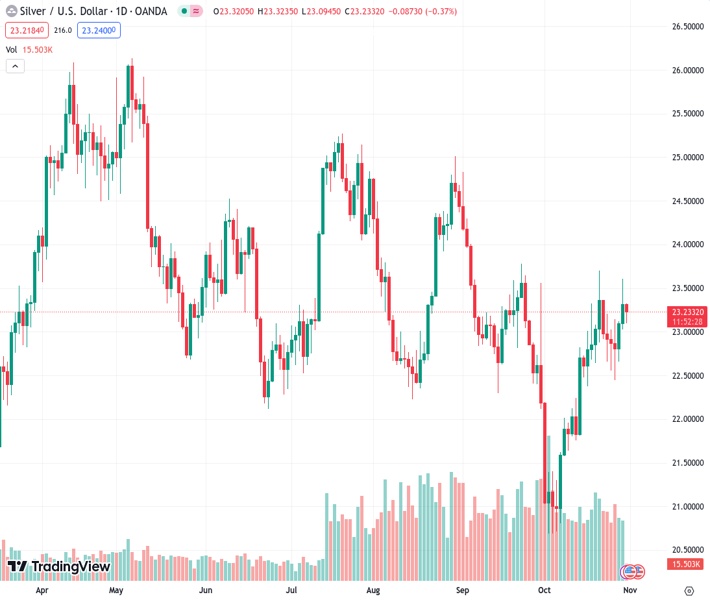
#XAGUSD @ 23.220 Silver drifts lower on Tuesday and snaps a two-day winning streak to over a one-week high.
…
This is a premium post.
[s2If !current_user_can(access_s2member_level4)]Please register for FREE REGISTER to read full post below containing analysis. In case of any error or you think you are not able to read the full post below, please email us at support#nehcap.com [lwa][/s2If] [s2If current_user_can(access_s2member_level1)]
- Silver drifts lower on Tuesday and snaps a two-day winning streak to over a one-week high.
The pair currently trades last at 23.220.
The previous day high was 23.61 while the previous day low was 23.02. The daily 38.2% Fib levels comes at 23.38, expected to provide resistance. Similarly, the daily 61.8% fib level is at 23.24, expected to provide resistance.
Silver (XAG/USD) extends the previous day’s retracement slide from the $23.60-$23.70 horizontal resistance and remains under some selling pressure through the first half of the European session on Tuesday. The white metal currently trades around the $23.20-$23.15 region, down over 0.50% for the day, and for now, seems to have snapped a two-day winning streak.
From a technical perspective, the recent repeated failures to find acceptance above the 200-day Simple Moving Average (SMA) and the subsequent pullbacks from the $23.60-$23.70 supply zone warrant caution for bullish traders. That said, oscillators on the daily chart are holding in the positive territory and support prospects for the emergence of some dip-buying. Hence, it will be prudent to wait for some follow-through selling below the $23.00 mark before positioning for any further depreciating move.
The XAG/USD might then accelerate the fall towards testing last week’s swing low, around the $22.45 region. This is closely followed by the $22.30-$22.25 horizontal resistance breakpoint now turned support, which if broken decisively will be seen as a fresh trigger for bearish traders. The downward trajectory could then get extended further towards the $22.00 round-figure mark en route to the $21.70 horizontal support.
On the flip side, momentum beyond the $23.35 region (200-day SMA) might continue to confront hurdle near the $23.60-$23.70 zone. A sustained strength beyond should allow the XAG/USD to reclaim the $24.00 mark and climb further towards testing the next relevant barrier near the $24.20 region. Some follow-through buying will confirm a fresh breakout and allow the white metal to make a fresh attempt towards conquering the $25.00 psychological mark.
Technical Levels: Supports and Resistances
XAGUSD currently trading at 23.18 at the time of writing. Pair opened at 23.32 and is trading with a change of -0.6 % .
| Overview | Overview.1 | |
|---|---|---|
| 0 | Today last price | 23.18 |
| 1 | Today Daily Change | -0.14 |
| 2 | Today Daily Change % | -0.60 |
| 3 | Today daily open | 23.32 |
The pair is trading above its 20 Daily moving average @ 22.39, above its 50 Daily moving average @ 22.97 , below its 100 Daily moving average @ 23.24 and below its 200 Daily moving average @ 23.3
| Trends | Trends.1 | |
|---|---|---|
| 0 | Daily SMA20 | 22.39 |
| 1 | Daily SMA50 | 22.97 |
| 2 | Daily SMA100 | 23.24 |
| 3 | Daily SMA200 | 23.30 |
The previous day high was 23.61 while the previous day low was 23.02. The daily 38.2% Fib levels comes at 23.38, expected to provide resistance. Similarly, the daily 61.8% fib level is at 23.24, expected to provide resistance.
Note the levels of interest below:
- Pivot support is noted at 23.03, 22.73, 22.44
- Pivot resistance is noted at 23.61, 23.91, 24.2
| Levels | Levels.1 |
|---|---|
| Previous Daily High | 23.61 |
| Previous Daily Low | 23.02 |
| Previous Weekly High | 23.36 |
| Previous Weekly Low | 22.44 |
| Previous Monthly High | 24.82 |
| Previous Monthly Low | 22.12 |
| Daily Fibonacci 38.2% | 23.38 |
| Daily Fibonacci 61.8% | 23.24 |
| Daily Pivot Point S1 | 23.03 |
| Daily Pivot Point S2 | 22.73 |
| Daily Pivot Point S3 | 22.44 |
| Daily Pivot Point R1 | 23.61 |
| Daily Pivot Point R2 | 23.91 |
| Daily Pivot Point R3 | 24.20 |
[/s2If]
Download Nehcap EAWe have two EAs that are operational on our LIVE accounts.
- EA-FIX: Check out the details here. Download EA-FIX . EA-FIX is a non-grid HFT scalper.
- EA-GROWTH: High quality low dd EA using trend grids. Download EA_GROWTHJoin Our Telegram Group


