#USDCAD @ 1.38405 could revisit the yearly high on the back of weaker Crude oil prices.
…
This is a premium post.
[s2If !current_user_can(access_s2member_level4)]Please register for FREE REGISTER to read full post below containing analysis. In case of any error or you think you are not able to read the full post below, please email us at support#nehcap.com [lwa][/s2If] [s2If current_user_can(access_s2member_level1)]
- USD/CAD could revisit the yearly high on the back of weaker Crude oil prices.
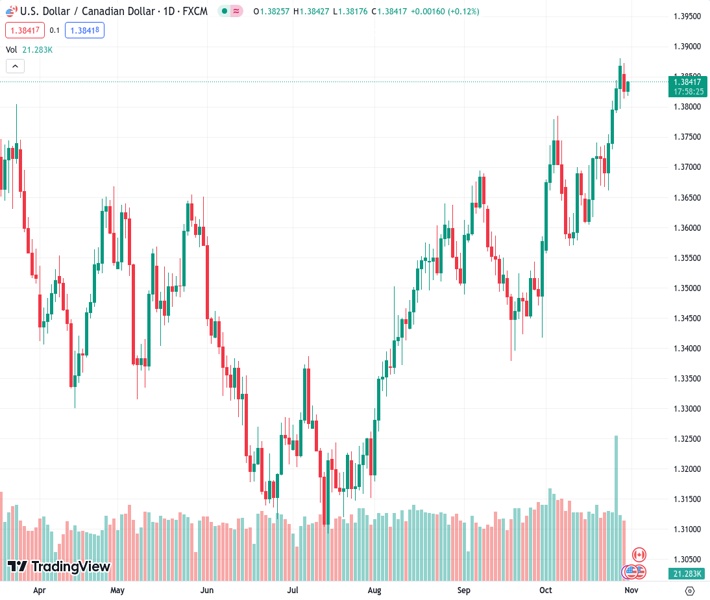
The pair currently trades last at 1.38405.
The previous day high was 1.3873 while the previous day low was 1.3813. The daily 38.2% Fib levels comes at 1.3836, expected to provide support. Similarly, the daily 61.8% fib level is at 1.385, expected to provide resistance.
USD/CAD retraces recent losses post retreating from a yearly high, trading higher near 1.3840 during the Asian session on Tuesday. The pair could receive upward support on the back of downbeat Crude oil prices. The weaker Chinese Purchasing Managers’ Index (PMI) data could bring some pressure on the prices of Oil, which could reinforce the strength of the USD/CAD pair ahead of the policy decision from the US Federal Reserve (Fed) on Wednesday.
Bank of Canada (BoC) Governor Tiff Macklem conveyed to lawmakers in the House of Commons on Monday that the intersection of elevated interest rates and subdued growth will have repercussions on the government’s spending. While acknowledging the country’s sustainable fiscal position, Macklem emphasized the need to exercise restraint in expenditure to safeguard social programs in the face of these economic dynamics.
The anticipation that the US Federal Reserve will maintain its policy rate at 5.5% in the upcoming meeting is dampening the strength of the US Dollar (USD). Adding to this, the release of moderate economic data from the United States on Friday did little to bolster the Greenback.
Western Texas Intermediate (WTI) trades below $82.50 per barrel at the time of writing. Traders adopt a cautious approach before the upcoming US Fed policy meeting, overshadowing the support previously provided by tensions in the Middle East.
The twist in China’s economic narrative came in September as the NBS Manufacturing Purchasing Managers’ Index (PMI) unexpectedly contracted to 49.5, which was expected to remain consistent at the 50.2 expansion seen in July. The index slipping below the crucial 50 mark, signaling contraction, adds a layer of concern. Furthermore, the NBS Services PMI mirrored this trend, dropping to 50.6, compared to the expected 51.8 and the previous reading of 51.7. These shifts in both the manufacturing and services sectors raise concerns about the depressed economic conditions in China.
The US Dollar Index (DXY) retraces the recent losses ahead of the Fed decision, trading around 106.30 by the press time. The prevailing market expectation that the Fed will keep interest rates steady at 5.5% in the upcoming policy meeting is anticipated to provide support for US Treasury bonds. The increased demand for T-bills is pushing down US Treasury yields, exerting downward pressure on the Greenback.
Additionally, investors will also monitor key indicators such as the US ADP Employment Change and the ISM Manufacturing PMI for October for further cues on US economic situation.
Technical Levels: Supports and Resistances
USDCAD currently trading at 1.3841 at the time of writing. Pair opened at 1.3827 and is trading with a change of 0.1 % .
| Overview | Overview.1 | |
|---|---|---|
| 0 | Today last price | 1.3841 |
| 1 | Today Daily Change | 0.0014 |
| 2 | Today Daily Change % | 0.1000 |
| 3 | Today daily open | 1.3827 |
The pair remains strongly bullish on the daily timeframe. It trades above its 20 SMA @ 1.3705, 50 SMA 1.3612, 100 SMA @ 1.3449 and 200 SMA @ 1.3482.
| Trends | Trends.1 | |
|---|---|---|
| 0 | Daily SMA20 | 1.3705 |
| 1 | Daily SMA50 | 1.3612 |
| 2 | Daily SMA100 | 1.3449 |
| 3 | Daily SMA200 | 1.3482 |
The previous day high was 1.3873 while the previous day low was 1.3813. The daily 38.2% Fib levels comes at 1.3836, expected to provide support. Similarly, the daily 61.8% fib level is at 1.385, expected to provide resistance.
Note the levels of interest below:
- Pivot support is noted at 1.3802, 1.3778, 1.3742
- Pivot resistance is noted at 1.3862, 1.3898, 1.3922
| Levels | Levels.1 |
|---|---|
| Previous Daily High | 1.3873 |
| Previous Daily Low | 1.3813 |
| Previous Weekly High | 1.3881 |
| Previous Weekly Low | 1.3661 |
| Previous Monthly High | 1.3694 |
| Previous Monthly Low | 1.3379 |
| Daily Fibonacci 38.2% | 1.3836 |
| Daily Fibonacci 61.8% | 1.3850 |
| Daily Pivot Point S1 | 1.3802 |
| Daily Pivot Point S2 | 1.3778 |
| Daily Pivot Point S3 | 1.3742 |
| Daily Pivot Point R1 | 1.3862 |
| Daily Pivot Point R2 | 1.3898 |
| Daily Pivot Point R3 | 1.3922 |
[/s2If]
Download Nehcap EAWe have two EAs that are operational on our LIVE accounts.
- EA-FIX: Check out the details here. Download EA-FIX . EA-FIX is a non-grid HFT scalper.
- EA-GROWTH: High quality low dd EA using trend grids. Download EA_GROWTHJoin Our Telegram Group


