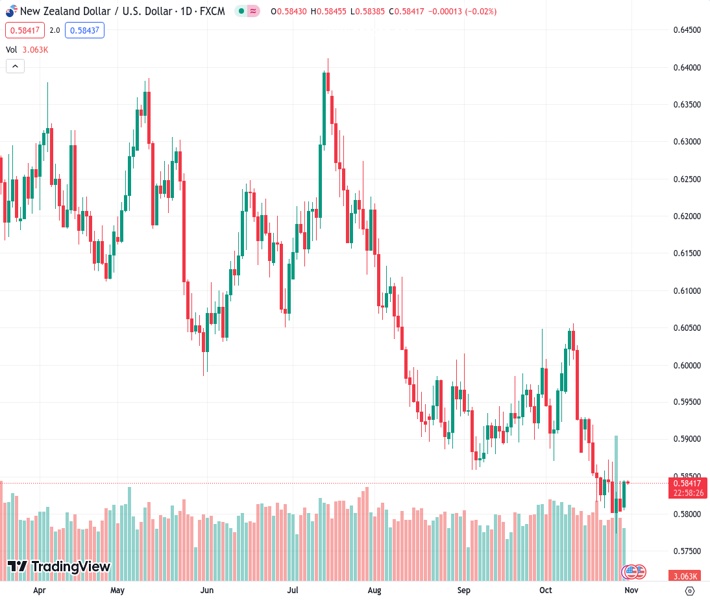
#NZDUSD @ 0.58416 The is seeing a rebound amidst a broad-market US Dollar selloff.
…
This is a premium post.
[s2If !current_user_can(access_s2member_level4)]Please register for FREE REGISTER to read full post below containing analysis. In case of any error or you think you are not able to read the full post below, please email us at support#nehcap.com [lwa][/s2If] [s2If current_user_can(access_s2member_level1)]
- The NZD/USD is seeing a rebound amidst a broad-market US Dollar selloff.
The pair currently trades last at 0.58416.
The previous day high was 0.5844 while the previous day low was 0.5805. The daily 38.2% Fib levels comes at 0.582, expected to provide support. Similarly, the daily 61.8% fib level is at 0.5829, expected to provide support.
The NZD/USD is seeing its best trading day in a month, climbing from an eleven-month low into 0.5850 for Monday.
Late Tuesday sees New Zealand unemployment rate, followed by a speech from Reserve Bank of New Zealand (RBNZ) Governor Adrian Orr.
Before that, China’s October Manufacturing Purchasing Managers’ Index (PMI) is expected to print in expansion territory for the second month in a row, forecast to come in at 50.2. The Non-Manufacturing sector PMI is likewise expected to improve from 51.7 to 51.8.
On the Greenback side, USD traders will be looking ahead to the midweek’s Federal Reserve (Fed) rate call.
The Kiwi’s Monday lift into 0.5850 still sees the NZD/USD woefully beaten into bear country on the daily candlesticks, with the pair trading well lower against the last swing high into 0.6050, with prices continuing to decline against the 50-day Simple Moving Average (SMA) currently declining towards 0.5900.
Long-term, the 200-day SMA is turning increasingly bearish, accelerating into chart territory south of 0.6150, and a downside continuation for the Kiwi will see the pair setting new lows for the year and testing bids not seen since October of 2022.
Technical Levels: Supports and Resistances
NZDUSD currently trading at 0.5845 at the time of writing. Pair opened at 0.581 and is trading with a change of 0.6 % .
| Overview | Overview.1 | |
|---|---|---|
| 0 | Today last price | 0.5845 |
| 1 | Today Daily Change | 0.0035 |
| 2 | Today Daily Change % | 0.6000 |
| 3 | Today daily open | 0.5810 |
The pair remains strongly bearish on the daily time frame. It trades below the 20 SMA @ 0.5905, 50 SMA 0.592, 100 SMA @ 0.6035 and 200 SMA @ 0.6134.
| Trends | Trends.1 | |
|---|---|---|
| 0 | Daily SMA20 | 0.5905 |
| 1 | Daily SMA50 | 0.5920 |
| 2 | Daily SMA100 | 0.6035 |
| 3 | Daily SMA200 | 0.6134 |
The previous day high was 0.5844 while the previous day low was 0.5805. The daily 38.2% Fib levels comes at 0.582, expected to provide support. Similarly, the daily 61.8% fib level is at 0.5829, expected to provide support.
Note the levels of interest below:
- Pivot support is noted at 0.5795, 0.5781, 0.5756
- Pivot resistance is noted at 0.5834, 0.5859, 0.5874
| Levels | Levels.1 |
|---|---|
| Previous Daily High | 0.5844 |
| Previous Daily Low | 0.5805 |
| Previous Weekly High | 0.5874 |
| Previous Weekly Low | 0.5772 |
| Previous Monthly High | 0.6050 |
| Previous Monthly Low | 0.5847 |
| Daily Fibonacci 38.2% | 0.5820 |
| Daily Fibonacci 61.8% | 0.5829 |
| Daily Pivot Point S1 | 0.5795 |
| Daily Pivot Point S2 | 0.5781 |
| Daily Pivot Point S3 | 0.5756 |
| Daily Pivot Point R1 | 0.5834 |
| Daily Pivot Point R2 | 0.5859 |
| Daily Pivot Point R3 | 0.5874 |
[/s2If]
Download Nehcap EAWe have two EAs that are operational on our LIVE accounts.
- EA-FIX: Check out the details here. Download EA-FIX . EA-FIX is a non-grid HFT scalper.
- EA-GROWTH: High quality low dd EA using trend grids. Download EA_GROWTHJoin Our Telegram Group


