#USDCHF @ 0.90155 up 0.07%, trading around 0.9015, after breaching 200-DMA at 0.9005.
…
This is a premium post.
[s2If !current_user_can(access_s2member_level4)]Please register for FREE REGISTER to read full post below containing analysis. In case of any error or you think you are not able to read the full post below, please email us at support#nehcap.com [lwa][/s2If] [s2If current_user_can(access_s2member_level1)]
- USD/CHF up 0.07%, trading around 0.9015, after breaching 200-DMA at 0.9005.
The pair currently trades last at 0.90155.
The previous day high was 0.9035 while the previous day low was 0.898. The daily 38.2% Fib levels comes at 0.9014, expected to provide support. Similarly, the daily 61.8% fib level is at 0.9001, expected to provide support.
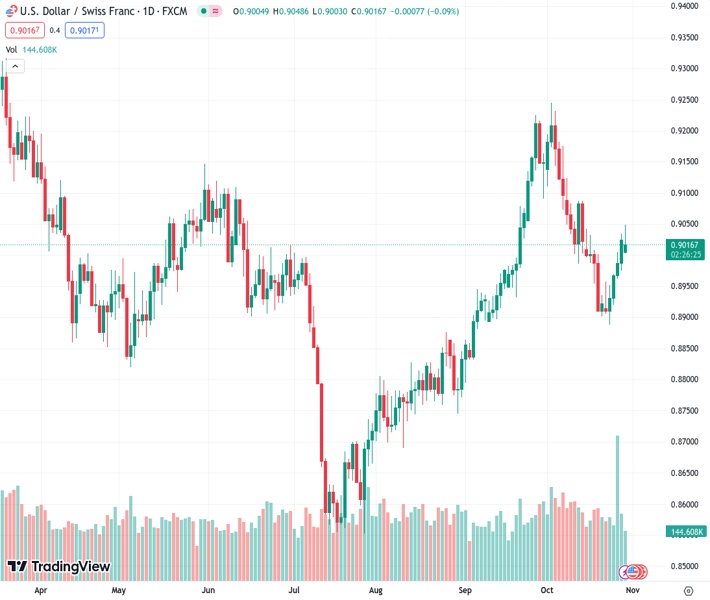
USD/CHF prolongs its gains to five consecutive days, breaching the 200-day moving average (DMA) at 0.9005, with buyers maintaining the pair in positive territory, up 0.07%, hovering around the 0.9015 area.
Wall Street trades with gains, with traders unfazed by the Middle East conflict. In fact, falling commodity prices are seen as a sign that market players are looking toward riskier assets, a headwind for the safe-haven status of the Swissie.
Aside from this, the USD/CHF daily chart portrays the pair as neutral to upward biased but shy of breaking the latest cycle high reached on October 3, at 0.9245. If buyers lift the exchange rates past the latter, the uptrend would likely extend toward the March 2 daily high at 0.9440.
On the other hand, if USD/CHF sellers moved in and dragged the spot price below 0.9000, they could push the pair toward the October 24 low of 0.8887 before falling to the August 30 pivot low of 0.8744.
Technical Levels: Supports and Resistances
USDCHF currently trading at 0.9018 at the time of writing. Pair opened at 0.9028 and is trading with a change of -0.11 % .
| Overview | Overview.1 | |
|---|---|---|
| 0 | Today last price | 0.9018 |
| 1 | Today Daily Change | -0.0010 |
| 2 | Today Daily Change % | -0.1100 |
| 3 | Today daily open | 0.9028 |
The pair is trading below its 20 Daily moving average @ 0.9034, above its 50 Daily moving average @ 0.8977 , above its 100 Daily moving average @ 0.8897 and above its 200 Daily moving average @ 0.9008
| Trends | Trends.1 | |
|---|---|---|
| 0 | Daily SMA20 | 0.9034 |
| 1 | Daily SMA50 | 0.8977 |
| 2 | Daily SMA100 | 0.8897 |
| 3 | Daily SMA200 | 0.9008 |
The previous day high was 0.9035 while the previous day low was 0.898. The daily 38.2% Fib levels comes at 0.9014, expected to provide support. Similarly, the daily 61.8% fib level is at 0.9001, expected to provide support.
Note the levels of interest below:
- Pivot support is noted at 0.8994, 0.896, 0.894
- Pivot resistance is noted at 0.9049, 0.9069, 0.9103
| Levels | Levels.1 |
|---|---|
| Previous Daily High | 0.9035 |
| Previous Daily Low | 0.8980 |
| Previous Weekly High | 0.9035 |
| Previous Weekly Low | 0.8888 |
| Previous Monthly High | 0.9225 |
| Previous Monthly Low | 0.8795 |
| Daily Fibonacci 38.2% | 0.9014 |
| Daily Fibonacci 61.8% | 0.9001 |
| Daily Pivot Point S1 | 0.8994 |
| Daily Pivot Point S2 | 0.8960 |
| Daily Pivot Point S3 | 0.8940 |
| Daily Pivot Point R1 | 0.9049 |
| Daily Pivot Point R2 | 0.9069 |
| Daily Pivot Point R3 | 0.9103 |
[/s2If]
Download Nehcap EAWe have two EAs that are operational on our LIVE accounts.
- EA-FIX: Check out the details here. Download EA-FIX . EA-FIX is a non-grid HFT scalper.
- EA-GROWTH: High quality low dd EA using trend grids. Download EA_GROWTHJoin Our Telegram Group


