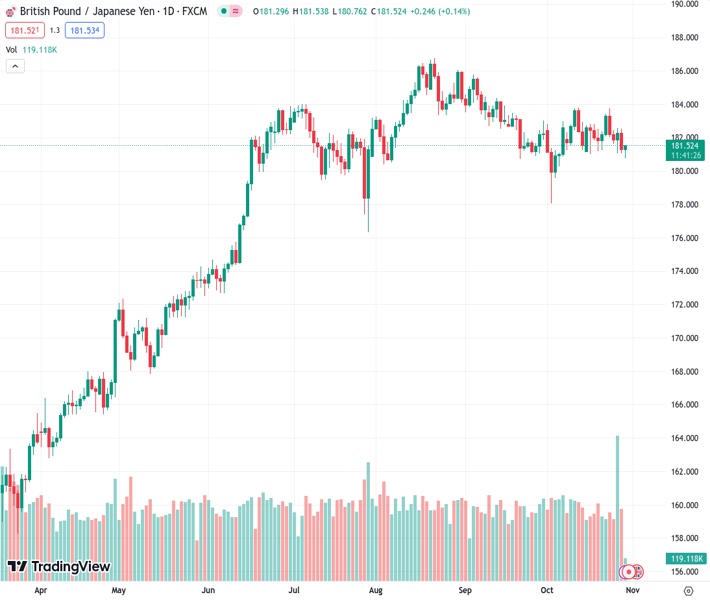
#GBPJPY @ 181.432 drifts lower for the second straight day and slides to a fresh multi-week low on Monday.
…
This is a premium post.
[s2If !current_user_can(access_s2member_level4)]Please register for FREE REGISTER to read full post below containing analysis. In case of any error or you think you are not able to read the full post below, please email us at support#nehcap.com [lwa][/s2If] [s2If current_user_can(access_s2member_level1)]
- GBP/JPY drifts lower for the second straight day and slides to a fresh multi-week low on Monday.
The pair currently trades last at 181.432.
The previous day high was 182.52 while the previous day low was 181.04. The daily 38.2% Fib levels comes at 181.61, expected to provide resistance. Similarly, the daily 61.8% fib level is at 181.95, expected to provide resistance.
The GBP/JPY cross remains under some selling pressure for the second successive day on Monday and drops to over a three-week low, around the 180.75 region during the first half of the European session. Spot prices, however, manage to rebound a few pips in the last hour and currently trade just above the 181.00 mark, still down over 0.15% for the day.
The British Pound’s (GBP) relative underperformance comes on the back of expectations that the Bank of England (BoE) will leave the benchmark interest rate on hold at a 15-year high of 5.25% for the second successive time to support the ailing economy. In contrast, investors have been speculating about a possible change in the Bank of Japan’s (BoJ) yield curve control (YCC) policy in the wake of a sign of broadening price pressures. This, in turn, is seen lending some support to the Japanese Yen (JPY) and contributing to the offered tone surrounding the GBP/JPY cross.
The Japanese central bank, however, is widely anticipated to stick to its negative policy rates. This, along with a positive tone around the equity markets, caps gains for the safe-haven JPY and helps limit the downside for the GBP/JPY cross. Traders also seem reluctant to place aggressive directional bets and prefer to wait on the sidelines ahead of the key central bank event risks – the BoJ policy meeting on Tuesday, followed by the BoE policy update on Thursday. This, in turn, warrants some caution for bearish traders and positioning for any further depreciating move.
From a technical perspective, the recent repeated failures to find acceptance above the 50-day Simple Moving Average (SMA) and the subsequent decline suggest that the path of least resistance for the GBP/JPY cross favours bearish traders. Moreover, oscillators on the daily chart have just started drifting in the negative territory and support prospects for further losses. Hence, some follow-through weakness towards the 180.40 intermediate support, en route to the 180.00 psychological mark, looks like a distinct possibility.
Technical Levels: Supports and Resistances
GBPJPY currently trading at 181.06 at the time of writing. Pair opened at 181.39 and is trading with a change of -0.18 % .
| Overview | Overview.1 | |
|---|---|---|
| 0 | Today last price | 181.06 |
| 1 | Today Daily Change | -0.33 |
| 2 | Today Daily Change % | -0.18 |
| 3 | Today daily open | 181.39 |
The pair is trading below its 20 Daily moving average @ 182.04, below its 50 Daily moving average @ 183.02 , below its 100 Daily moving average @ 182.5 and above its 200 Daily moving average @ 174.03
| Trends | Trends.1 | |
|---|---|---|
| 0 | Daily SMA20 | 182.04 |
| 1 | Daily SMA50 | 183.02 |
| 2 | Daily SMA100 | 182.50 |
| 3 | Daily SMA200 | 174.03 |
The previous day high was 182.52 while the previous day low was 181.04. The daily 38.2% Fib levels comes at 181.61, expected to provide resistance. Similarly, the daily 61.8% fib level is at 181.95, expected to provide resistance.
Note the levels of interest below:
- Pivot support is noted at 180.78, 180.18, 179.31
- Pivot resistance is noted at 182.26, 183.12, 183.73
| Levels | Levels.1 |
|---|---|
| Previous Daily High | 182.52 |
| Previous Daily Low | 181.04 |
| Previous Weekly High | 183.75 |
| Previous Weekly Low | 181.04 |
| Previous Monthly High | 185.78 |
| Previous Monthly Low | 180.82 |
| Daily Fibonacci 38.2% | 181.61 |
| Daily Fibonacci 61.8% | 181.95 |
| Daily Pivot Point S1 | 180.78 |
| Daily Pivot Point S2 | 180.18 |
| Daily Pivot Point S3 | 179.31 |
| Daily Pivot Point R1 | 182.26 |
| Daily Pivot Point R2 | 183.12 |
| Daily Pivot Point R3 | 183.73 |
[/s2If]
Download Nehcap EAWe have two EAs that are operational on our LIVE accounts.
- EA-FIX: Check out the details here. Download EA-FIX . EA-FIX is a non-grid HFT scalper.
- EA-GROWTH: High quality low dd EA using trend grids. Download EA_GROWTHJoin Our Telegram Group


