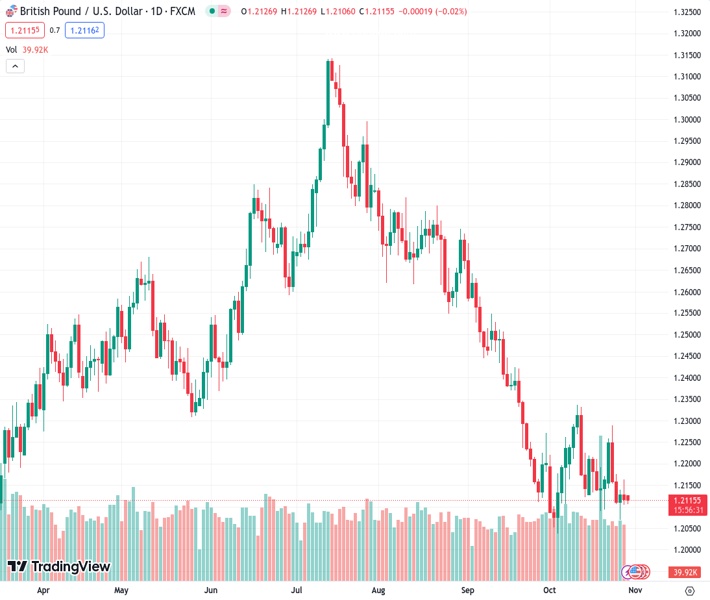
#GBPUSD @ 1.21162 maintains its position ahead of the central banks’ policy decisions.
…
This is a premium post.
[s2If !current_user_can(access_s2member_level4)]Please register for FREE REGISTER to read full post below containing analysis. In case of any error or you think you are not able to read the full post below, please email us at support#nehcap.com [lwa][/s2If] [s2If current_user_can(access_s2member_level1)]
- GBP/USD maintains its position ahead of the central banks’ policy decisions.
The pair currently trades last at 1.21162.
The previous day high was 1.2163 while the previous day low was 1.2106. The daily 38.2% Fib levels comes at 1.2128, expected to provide resistance. Similarly, the daily 61.8% fib level is at 1.2141, expected to provide resistance.
GBP/USD hovers around the 1.2120 level with a negative tone during the Asian session on Monday. The pair moves sideways ahead of the policy meetings of the US Federal Reserve (Fed) on Wednesday and the Bank of England (BoE) meeting on Thursday.
The GBP/USD pair could find immediate support at the 1.2000 psychological level. A firm break below the level could open the doors for the pair to navigate the region near the monthly low at 1.2037 level.
On the upside, the 1.2150 appears to be the key barrier aligned with the 14-day Exponential Moving Average (EMA) at 1.2162, following the 1.2200 major level. A firm breakthrough above the latter could support the GBP/USD pair to explore the area around the 23.6% Fibonacci retracement at the 1.2298 level.
The Moving Average Convergence Divergence (MACD) line persists below the centerline but stays above the signal line, suggesting a tepid momentum for the GBP/USD pair.
Moreover, The GBP/USD duo seems to be experiencing a subdued momentum, and the 14-day Relative Strength Index (RSI) is indicating a clear tilt toward weakness. The technical indicator, dipping below the 50 level, signals a potential bearish momentum.
Technical Levels: Supports and Resistances
GBPUSD currently trading at 1.2119 at the time of writing. Pair opened at 1.2121 and is trading with a change of -0.02 % .
| Overview | Overview.1 | |
|---|---|---|
| 0 | Today last price | 1.2119 |
| 1 | Today Daily Change | -0.0002 |
| 2 | Today Daily Change % | -0.0200 |
| 3 | Today daily open | 1.2121 |
The pair remains strongly bearish on the daily time frame. It trades below the 20 SMA @ 1.2175, 50 SMA 1.2352, 100 SMA @ 1.257 and 200 SMA @ 1.2439.
| Trends | Trends.1 | |
|---|---|---|
| 0 | Daily SMA20 | 1.2175 |
| 1 | Daily SMA50 | 1.2352 |
| 2 | Daily SMA100 | 1.2570 |
| 3 | Daily SMA200 | 1.2439 |
The previous day high was 1.2163 while the previous day low was 1.2106. The daily 38.2% Fib levels comes at 1.2128, expected to provide resistance. Similarly, the daily 61.8% fib level is at 1.2141, expected to provide resistance.
Note the levels of interest below:
- Pivot support is noted at 1.2097, 1.2073, 1.204
- Pivot resistance is noted at 1.2154, 1.2187, 1.2211
| Levels | Levels.1 |
|---|---|
| Previous Daily High | 1.2163 |
| Previous Daily Low | 1.2106 |
| Previous Weekly High | 1.2289 |
| Previous Weekly Low | 1.2070 |
| Previous Monthly High | 1.2713 |
| Previous Monthly Low | 1.2111 |
| Daily Fibonacci 38.2% | 1.2128 |
| Daily Fibonacci 61.8% | 1.2141 |
| Daily Pivot Point S1 | 1.2097 |
| Daily Pivot Point S2 | 1.2073 |
| Daily Pivot Point S3 | 1.2040 |
| Daily Pivot Point R1 | 1.2154 |
| Daily Pivot Point R2 | 1.2187 |
| Daily Pivot Point R3 | 1.2211 |
[/s2If]
Download Nehcap EAWe have two EAs that are operational on our LIVE accounts.
- EA-FIX: Check out the details here. Download EA-FIX . EA-FIX is a non-grid HFT scalper.
- EA-GROWTH: High quality low dd EA using trend grids. Download EA_GROWTHJoin Our Telegram Group


