#USDMXN @ 18.0962 receives upward support as Crude prices could surge due to Middle-East conflict.
…
This is a premium post.
[s2If !current_user_can(access_s2member_level4)]Please register for FREE REGISTER to read full post below containing analysis. In case of any error or you think you are not able to read the full post below, please email us at support#nehcap.com [lwa][/s2If] [s2If current_user_can(access_s2member_level1)]
- USD/MXN receives upward support as Crude prices could surge due to Middle-East conflict.
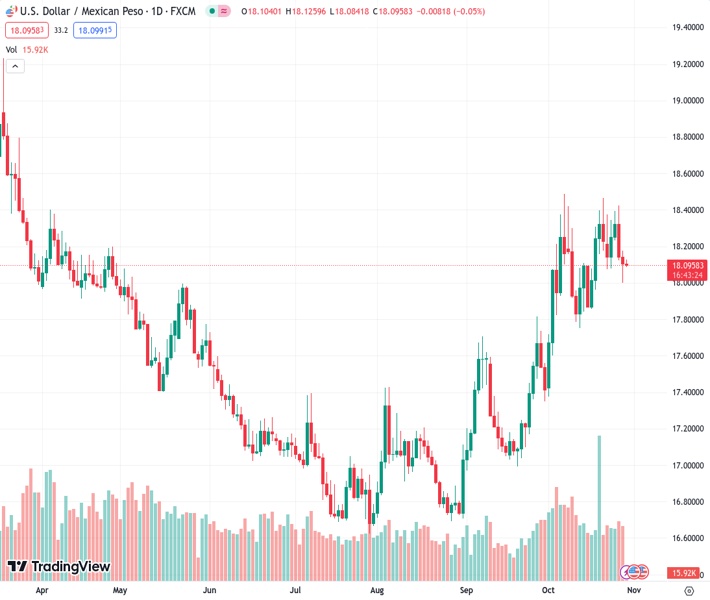
The pair currently trades last at 18.0962.
The previous day high was 18.1771 while the previous day low was 18.0002. The daily 38.2% Fib levels comes at 18.0678, expected to provide support. Similarly, the daily 61.8% fib level is at 18.1095, expected to provide resistance.
USD/MXN continues the downward trajectory for the third successive session since Mexico’s employment data revealed a robust labor market, showcasing the enduring strength of the Mexican economy. The pair trades lower around 18.0900 during the Asian session on Monday.
On Thursday, Mexico’s Jobless Rate showed a decline to 2.9% in September from August’s 3.0%. However, Mexico revealed on Friday its Trade Balance report, which showed that the trade deficit widened in September from $1.377B in August to $1.481B.
Additionally, the escalating Middle-East conflict is supposed to reinforce commodity prices like Crude oil and Gold, which might provide some support to the Mexican Peso (MXN). Israel has expanded its ground operations in Gaza and attacked multiple Hamas sites, which could affect the currencies of the emerging markets including the MXN.
Deputy Governor Jonathan Heath of the Bank of Mexico (Banxico) recently pointed out that the increasing government debt in 2024 will introduce an additional challenge to the battle against inflation. He emphasized the existence of a desynchronization between monetary and fiscal policies.
The US Dollar Index (DXY) seems to be keeping a low profile, remaining relatively silent as a decline in US Treasury yields puts pressure on the Greenback. However, the 10-year US Bond yield is showing signs of a rebound at 4.87% as of the latest update.
US Core Personal Consumption Expenditures Price Index data revealed on Friday, that the yearly index declined to 3.7% in September from 3.8% previous reading. The monthly figures improved to 0.3% from 0.1% previously.
All eyes are on the upcoming Federal Reserve (Fed) meeting scheduled on Wednesday, with the market sentiment currently leaning towards the expectation that interest rates will remain consistent at 5.5%.
Technical Levels: Supports and Resistances
USDMXN currently trading at 18.0913 at the time of writing. Pair opened at 18.1184 and is trading with a change of -0.15 % .
| Overview | Overview.1 | |
|---|---|---|
| 0 | Today last price | 18.0913 |
| 1 | Today Daily Change | -0.0271 |
| 2 | Today Daily Change % | -0.1500 |
| 3 | Today daily open | 18.1184 |
The pair is trading below its 20 Daily moving average @ 18.0963, above its 50 Daily moving average @ 17.5444 , above its 100 Daily moving average @ 17.2864 and above its 200 Daily moving average @ 17.734
| Trends | Trends.1 | |
|---|---|---|
| 0 | Daily SMA20 | 18.0963 |
| 1 | Daily SMA50 | 17.5444 |
| 2 | Daily SMA100 | 17.2864 |
| 3 | Daily SMA200 | 17.7340 |
The previous day high was 18.1771 while the previous day low was 18.0002. The daily 38.2% Fib levels comes at 18.0678, expected to provide support. Similarly, the daily 61.8% fib level is at 18.1095, expected to provide resistance.
Note the levels of interest below:
- Pivot support is noted at 18.02, 17.9216, 17.843
- Pivot resistance is noted at 18.197, 18.2756, 18.374
| Levels | Levels.1 |
|---|---|
| Previous Daily High | 18.1771 |
| Previous Daily Low | 18.0002 |
| Previous Weekly High | 18.4247 |
| Previous Weekly Low | 18.0002 |
| Previous Monthly High | 17.8174 |
| Previous Monthly Low | 16.9727 |
| Daily Fibonacci 38.2% | 18.0678 |
| Daily Fibonacci 61.8% | 18.1095 |
| Daily Pivot Point S1 | 18.0200 |
| Daily Pivot Point S2 | 17.9216 |
| Daily Pivot Point S3 | 17.8430 |
| Daily Pivot Point R1 | 18.1970 |
| Daily Pivot Point R2 | 18.2756 |
| Daily Pivot Point R3 | 18.3740 |
[/s2If]
Download Nehcap EAWe have two EAs that are operational on our LIVE accounts.
- EA-FIX: Check out the details here. Download EA-FIX . EA-FIX is a non-grid HFT scalper.
- EA-GROWTH: High quality low dd EA using trend grids. Download EA_GROWTHJoin Our Telegram Group
")


