#AUDUSD @ 0.63371 recovers from 0.6318 to trade around 0.6330s, up 0.22%.
…
This is a premium post.
[s2If !current_user_can(access_s2member_level4)]Please register for FREE REGISTER to read full post below containing analysis. In case of any error or you think you are not able to read the full post below, please email us at support#nehcap.com [lwa][/s2If] [s2If current_user_can(access_s2member_level1)]
- AUD/USD recovers from 0.6318 to trade around 0.6330s, up 0.22%.
The pair currently trades last at 0.63371.
The previous day high was 0.6331 while the previous day low was 0.627. The daily 38.2% Fib levels comes at 0.6307, expected to provide support. Similarly, the daily 61.8% fib level is at 0.6293, expected to provide support.
AUD/USD bounces off daily lows reached at 0.6318 and aims higher, registering gains of 0.22%, after economic data from the United States (US), although showed prices remain elevated, failed to shift speculations for additional rate hikes. At the time of writing, the pair exchanges hands at around 0.6330s.
Inflation data in the US, as shown by the US Bureau of Economic Analysis (BEA), revealed the core Personal Consumption Expenditures (PCE), which the Fed uses as the primary reference for gauging inflation, rose by 3.7% YoY, below August’s data aligned with estimates, while general inflation remained unchanged compared to August’s 3.4%, aligned with forecasts. Even though inflation has slowed, the PCE has shown signs of bottoming around 3.4-—3.5%, indicating that inflation remains stubbornly above the Fed’s 2% goal.
Recently, the University of Michigan (UoM) Consumer Sentiment on its final reading for October came at 63.8 above forecasts but deteriorated compared to August, while inflation expectations were upward revised from one year, from 3.8% to 4.2%. For the mid-term, inflation is expected at 3%, as foreseen.
On the Aussie front, the latest inflation report witnessed prices standing above 5%, increasing the odds for another rate hike by the Reserve Bank of Australia. The ASX RBA rate tracker projects a 47% chance for a 25-bps rate hike at the upcoming monetary policy meeting.
Notably: On the geopolitical front, AP reported that Israeli ground forces are expanding activity in Gaza, which could shift market sour, and weigh on the AUD/USD pair.
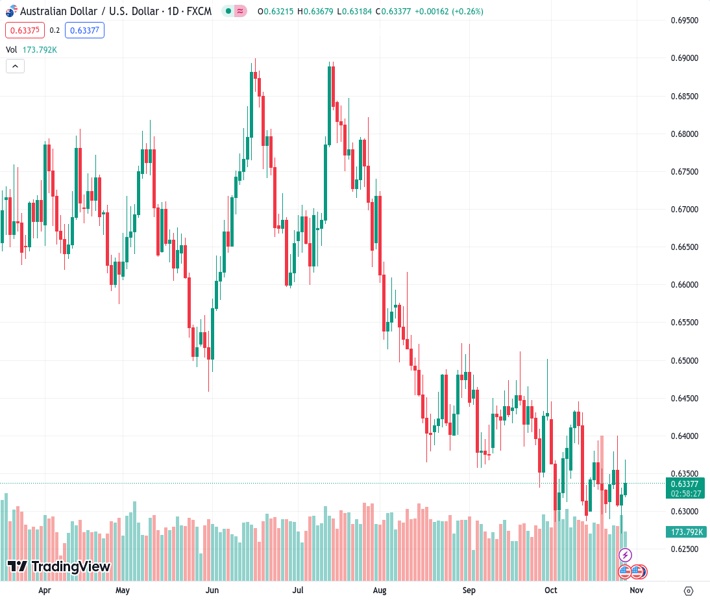
The daily chart portrays the AUD/USD formed a hammer, from which prices had bounced toward the current exchange rate. However, if buyers want to regain control, they must clear the 50-day moving average (DMA) at 0.6394, ahead of the 0.6400 figure. The next resistance would be the October 11 high of 0.6445, but it would remain shy of the latest cycle high of 0.6522. Conversely, if AUD/USD stays beneath 0.6400, that would keep the downtrend intact, and sellers could threaten to push prices past the current year-to-date (YTD) low of 0.6270. Next support emerges at 0.66200.
Technical Levels: Supports and Resistances
AUDUSD currently trading at 0.6338 at the time of writing. Pair opened at 0.6322 and is trading with a change of 0.25 % .
| Overview | Overview.1 | |
|---|---|---|
| 0 | Today last price | 0.6338 |
| 1 | Today Daily Change | 0.0016 |
| 2 | Today Daily Change % | 0.2500 |
| 3 | Today daily open | 0.6322 |
The pair remains strongly bearish on the daily time frame. It trades below the 20 SMA @ 0.6353, 50 SMA 0.6397, 100 SMA @ 0.654 and 200 SMA @ 0.6641.
| Trends | Trends.1 | |
|---|---|---|
| 0 | Daily SMA20 | 0.6353 |
| 1 | Daily SMA50 | 0.6397 |
| 2 | Daily SMA100 | 0.6540 |
| 3 | Daily SMA200 | 0.6641 |
The previous day high was 0.6331 while the previous day low was 0.627. The daily 38.2% Fib levels comes at 0.6307, expected to provide support. Similarly, the daily 61.8% fib level is at 0.6293, expected to provide support.
Note the levels of interest below:
- Pivot support is noted at 0.6284, 0.6247, 0.6224
- Pivot resistance is noted at 0.6345, 0.6368, 0.6405
| Levels | Levels.1 |
|---|---|
| Previous Daily High | 0.6331 |
| Previous Daily Low | 0.6270 |
| Previous Weekly High | 0.6393 |
| Previous Weekly Low | 0.6296 |
| Previous Monthly High | 0.6522 |
| Previous Monthly Low | 0.6332 |
| Daily Fibonacci 38.2% | 0.6307 |
| Daily Fibonacci 61.8% | 0.6293 |
| Daily Pivot Point S1 | 0.6284 |
| Daily Pivot Point S2 | 0.6247 |
| Daily Pivot Point S3 | 0.6224 |
| Daily Pivot Point R1 | 0.6345 |
| Daily Pivot Point R2 | 0.6368 |
| Daily Pivot Point R3 | 0.6405 |
[/s2If]
Download Nehcap EAWe have two EAs that are operational on our LIVE accounts.
- EA-FIX: Check out the details here. Download EA-FIX . EA-FIX is a non-grid HFT scalper.
- EA-GROWTH: High quality low dd EA using trend grids. Download EA_GROWTHJoin Our Telegram Group
")


