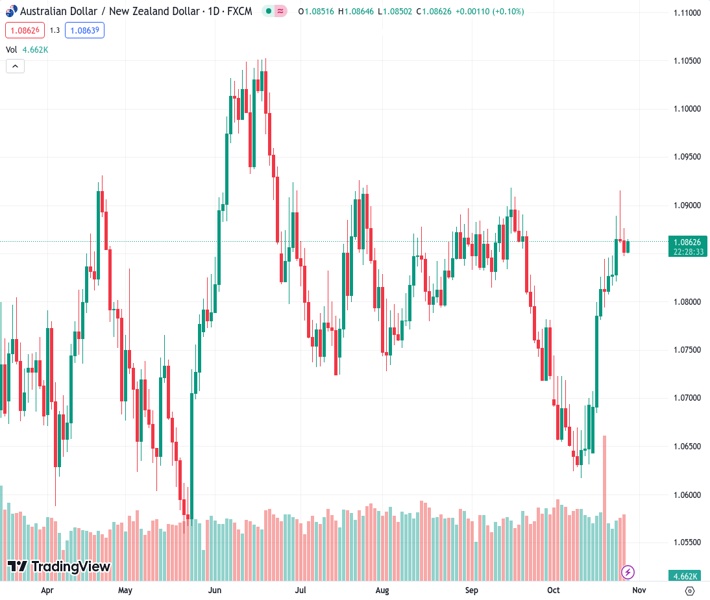
#AUDNZD @ 1.08570 The is seeing downside play after peaking near 1.0920 in the mid-week.
…
This is a premium post.
[s2If !current_user_can(access_s2member_level4)]Please register for FREE REGISTER to read full post below containing analysis. In case of any error or you think you are not able to read the full post below, please email us at support#nehcap.com [lwa][/s2If] [s2If current_user_can(access_s2member_level1)]
- The AUD/NZD is seeing downside play after peaking near 1.0920 in the mid-week.
The pair currently trades last at 1.08570.
The previous day high was 1.0915 while the previous day low was 1.086. The daily 38.2% Fib levels comes at 1.0881, expected to provide resistance. Similarly, the daily 61.8% fib level is at 1.0894, expected to provide resistance.
The AUD/NZD is trading into 1.0860 after Thursday’s market session saw the pair pull back towards the 200-day Simple Moving Average (SMA), tipping into a daily low of 1.0828 as the recent bullish upswing runs out of momentum.
The pair hit a one-month high of 1.0915 on Wednesday after rebounding 2.75% from October’s low near 1.0620.
The AUD/NZD has been steadily cycling the 200-day SMA for the majority of the year as the Aussie (AUD) and the Kiwi (NZD) battle it out for supremacy, with neither Antipodean gaining a firm technical foothold on the other.
The Relative Strength Index (RSI) is beginning to rotate downwards once more after losing momentum just shy of the signal line for overbought technical conditions, and the pair could be ripe for a late-stage bullish extension if Aussie traders find new data to chew on.
On the low side, the 50-day SMA continues to consolidate near the 200-day SMA, implying recent moves only had a temporary momentum effect, and the pair is set to see a return to chart paper near 1.0750.
Technical Levels: Supports and Resistances
AUDNZD currently trading at 1.0864 at the time of writing. Pair opened at 1.0873 and is trading with a change of -0.08 % .
| Overview | Overview.1 | |
|---|---|---|
| 0 | Today last price | 1.0864 |
| 1 | Today Daily Change | -0.0009 |
| 2 | Today Daily Change % | -0.0800 |
| 3 | Today daily open | 1.0873 |
The pair remains strongly bullish on the daily timeframe. It trades above its 20 SMA @ 1.0738, 50 SMA 1.0801, 100 SMA @ 1.083 and 200 SMA @ 1.0819.
| Trends | Trends.1 | |
|---|---|---|
| 0 | Daily SMA20 | 1.0738 |
| 1 | Daily SMA50 | 1.0801 |
| 2 | Daily SMA100 | 1.0830 |
| 3 | Daily SMA200 | 1.0819 |
The previous day high was 1.0915 while the previous day low was 1.086. The daily 38.2% Fib levels comes at 1.0881, expected to provide resistance. Similarly, the daily 61.8% fib level is at 1.0894, expected to provide resistance.
Note the levels of interest below:
- Pivot support is noted at 1.0851, 1.0828, 1.0796
- Pivot resistance is noted at 1.0906, 1.0938, 1.0961
| Levels | Levels.1 |
|---|---|
| Previous Daily High | 1.0915 |
| Previous Daily Low | 1.0860 |
| Previous Weekly High | 1.0846 |
| Previous Weekly Low | 1.0654 |
| Previous Monthly High | 1.0919 |
| Previous Monthly Low | 1.0718 |
| Daily Fibonacci 38.2% | 1.0881 |
| Daily Fibonacci 61.8% | 1.0894 |
| Daily Pivot Point S1 | 1.0851 |
| Daily Pivot Point S2 | 1.0828 |
| Daily Pivot Point S3 | 1.0796 |
| Daily Pivot Point R1 | 1.0906 |
| Daily Pivot Point R2 | 1.0938 |
| Daily Pivot Point R3 | 1.0961 |
[/s2If]
Download Nehcap EAWe have two EAs that are operational on our LIVE accounts.
- EA-FIX: Check out the details here. Download EA-FIX . EA-FIX is a non-grid HFT scalper.
- EA-GROWTH: High quality low dd EA using trend grids. Download EA_GROWTHJoin Our Telegram Group


