#USDSEK @ 11.16755 jumped to a high around 11.212 and then settled at around 11.180, seeing 0.35% gains.
…
This is a premium post.
[s2If !current_user_can(access_s2member_level4)]Please register for FREE REGISTER to read full post below containing analysis. In case of any error or you think you are not able to read the full post below, please email us at support#nehcap.com [lwa][/s2If] [s2If current_user_can(access_s2member_level1)]
- USD/SEK jumped to a high around 11.212 and then settled at around 11.180, seeing 0.35% gains.
The pair currently trades last at 11.16755.
The previous day high was 11.1899 while the previous day low was 11.0875. The daily 38.2% Fib levels comes at 11.1508, expected to provide support. Similarly, the daily 61.8% fib level is at 11.1266, expected to provide support.
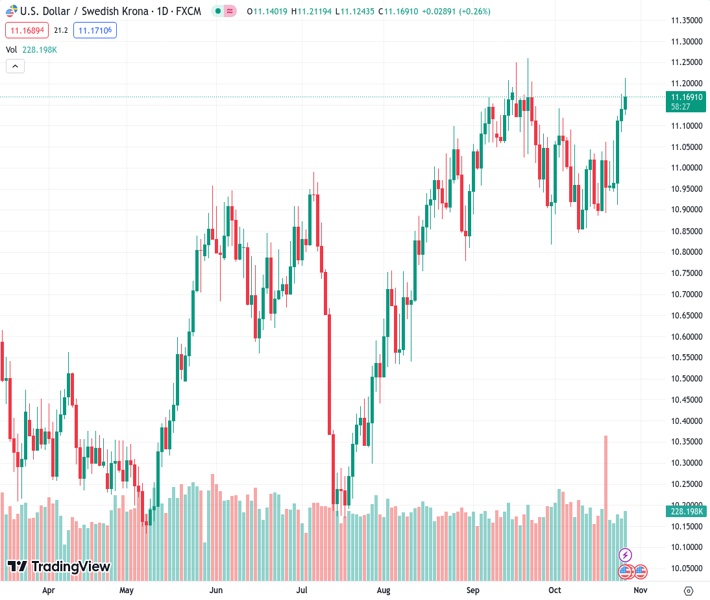
On Thursday, the USD/SEK gained further ground, tallying a five-day winning streak and jumping to its highest level since September 22 at 11.212. Strong data reported from the US is the main responsible for the Greenback outperforming its rivals but as US yields retreat, the upside is limited.
The U.S. Bureau of Economic Analysis reported that the Gross Domestic Product (GDP) Growth Rate preliminary estimate from Q3 came in above the consensus. It showed that the economy grew at an annualised rate of 4.9% QoQ vs the expected 4.2% and rose from its previous figure of 2.1%. On the negative side, the U.S. Department of Labor revealed that the Initial Jobless Claims from the week ending on October 21 exceeded expectations. The headline figure came in at 210,000, above the consensus of 208,000, and rose from its previous figure of 200,000.
Despite the strong GDP figures, investors focus on Jobless Claims accelerating as US Treasury yields fall. The 2,5, and 10-year yields fell towards 5.04%,4.80% and 4.84%, respectively, limiting the USD’s gains during the sessions. Another factor that could limit the pair’s upward trajectory is investors betting on higher of the Federal Reserve (Fed) not hiking again in 2023. The CME FedWatch Tool suggests that the odds of a 25 basis points hike in December fell to 20% and that a pause in November is nearly priced in.
However, Personal Consumption Expenditures (PCE) from September are due on Friday, which could impact the pair’s dynamics as that metric is the Fed’s preferred inflation gauge.
The daily chart analysis indicates a bullish outlook for the USD/SEK in the short term. The Relative Strength Index (RSI) is above its midline in positive territory, aligning with the positive signal from the Moving Average Convergence Divergence (MACD), which displays green bars, reinforcing the strong bullish sentiment. Also, the pair is above the 20,100,200-day Simple Moving Average (SMA), indicating a favourable position for the bulls in the bigger picture.
Support levels: 11.145, 11.087, 11.055.
Resistance levels: 11.200, 11.242, 11.265
Technical Levels: Supports and Resistances
USDSEK currently trading at 11.1803 at the time of writing. Pair opened at 11.1527 and is trading with a change of 0.25 % .
| Overview | Overview.1 | |
|---|---|---|
| 0 | Today last price | 11.1803 |
| 1 | Today Daily Change | 0.0276 |
| 2 | Today Daily Change % | 0.2500 |
| 3 | Today daily open | 11.1527 |
The pair remains strongly bullish on the daily timeframe. It trades above its 20 SMA @ 10.9891, 50 SMA 11.0284, 100 SMA @ 10.8354 and 200 SMA @ 10.6434.
| Trends | Trends.1 | |
|---|---|---|
| 0 | Daily SMA20 | 10.9891 |
| 1 | Daily SMA50 | 11.0284 |
| 2 | Daily SMA100 | 10.8354 |
| 3 | Daily SMA200 | 10.6434 |
The previous day high was 11.1899 while the previous day low was 11.0875. The daily 38.2% Fib levels comes at 11.1508, expected to provide support. Similarly, the daily 61.8% fib level is at 11.1266, expected to provide support.
Note the levels of interest below:
- Pivot support is noted at 11.0968, 11.041, 10.9944
- Pivot resistance is noted at 11.1992, 11.2458, 11.3016
| Levels | Levels.1 |
|---|---|
| Previous Daily High | 11.1899 |
| Previous Daily Low | 11.0875 |
| Previous Weekly High | 11.0629 |
| Previous Weekly Low | 10.8869 |
| Previous Monthly High | 11.4010 |
| Previous Monthly Low | 10.7524 |
| Daily Fibonacci 38.2% | 11.1508 |
| Daily Fibonacci 61.8% | 11.1266 |
| Daily Pivot Point S1 | 11.0968 |
| Daily Pivot Point S2 | 11.0410 |
| Daily Pivot Point S3 | 10.9944 |
| Daily Pivot Point R1 | 11.1992 |
| Daily Pivot Point R2 | 11.2458 |
| Daily Pivot Point R3 | 11.3016 |
[/s2If]
Download Nehcap EAWe have two EAs that are operational on our LIVE accounts.
- EA-FIX: Check out the details here. Download EA-FIX . EA-FIX is a non-grid HFT scalper.
- EA-GROWTH: High quality low dd EA using trend grids. Download EA_GROWTHJoin Our Telegram Group


