#XAGUSD @ 22.765 Silver price seesaw from daily high of $23.69 to low of $22.88, closing at $22.81.
…
This is a premium post.
[s2If !current_user_can(access_s2member_level4)]Please register for FREE REGISTER to read full post below containing analysis. In case of any error or you think you are not able to read the full post below, please email us at support#nehcap.com [lwa][/s2If] [s2If current_user_can(access_s2member_level1)]
- Silver price seesaw from daily high of $23.69 to low of $22.88, closing at $22.81.
The pair currently trades last at 22.765.
The previous day high was 23.02 while the previous day low was 22.56. The daily 38.2% Fib levels comes at 22.73, expected to provide support. Similarly, the daily 61.8% fib level is at 22.84, expected to provide resistance.
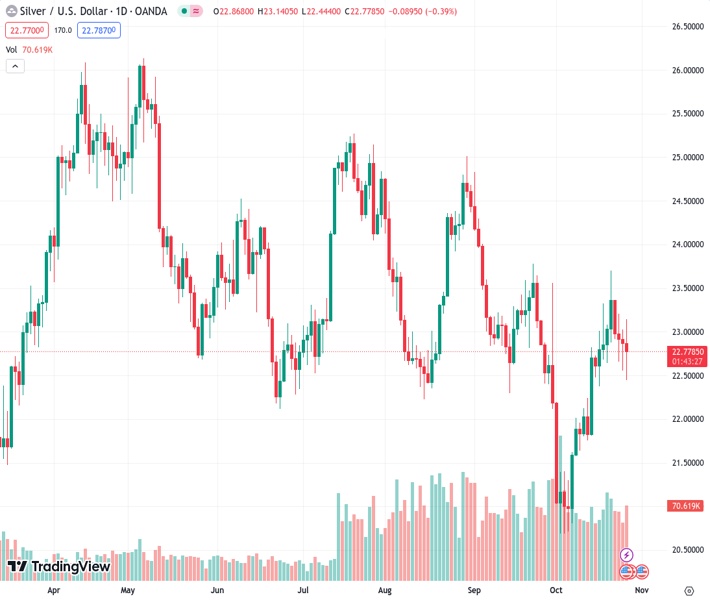
Silver price (XAG/USD) is almost flat during Thursday’s session after seesawing in a volatile day, reaching a daily high of $23.69 before diving towards its low of $22.88. As the Wall Street close looms, the XAG/USD trades at $22.81, registering losses of 0.12%.
The daily chart portrays the pair as neutral to downward biased, as the XAG/USD sits below the 50 and 200-day moving averages (DMAs), which would cap any rallies intents at $22.94 (50-DMA) and $23.29 (200-DMA). If those two levels are cleared, the next stop would be the top of the Bollinger-Band at $23.71, followed by $24.00.
On the downside, the first key support level lies at $23.00, followed by the October 26 low of $22.44. A breach of the latter would expose the 20-day Exponential Moving Average (EMA) at $22.21, before challenging the $22.00 mark.
Technical Levels: Supports and Resistances
XAGUSD currently trading at 22.82 at the time of writing. Pair opened at 22.86 and is trading with a change of -0.17 % .
| Overview | Overview.1 | |
|---|---|---|
| 0 | Today last price | 22.82 |
| 1 | Today Daily Change | -0.04 |
| 2 | Today Daily Change % | -0.17 |
| 3 | Today daily open | 22.86 |
The pair is trading above its 20 Daily moving average @ 22.22, below its 50 Daily moving average @ 22.96 , below its 100 Daily moving average @ 23.28 and below its 200 Daily moving average @ 23.31
| Trends | Trends.1 | |
|---|---|---|
| 0 | Daily SMA20 | 22.22 |
| 1 | Daily SMA50 | 22.96 |
| 2 | Daily SMA100 | 23.28 |
| 3 | Daily SMA200 | 23.31 |
The previous day high was 23.02 while the previous day low was 22.56. The daily 38.2% Fib levels comes at 22.73, expected to provide support. Similarly, the daily 61.8% fib level is at 22.84, expected to provide resistance.
Note the levels of interest below:
- Pivot support is noted at 22.6, 22.35, 22.14
- Pivot resistance is noted at 23.07, 23.28, 23.54
| Levels | Levels.1 |
|---|---|
| Previous Daily High | 23.02 |
| Previous Daily Low | 22.56 |
| Previous Weekly High | 23.70 |
| Previous Weekly Low | 22.37 |
| Previous Monthly High | 24.82 |
| Previous Monthly Low | 22.12 |
| Daily Fibonacci 38.2% | 22.73 |
| Daily Fibonacci 61.8% | 22.84 |
| Daily Pivot Point S1 | 22.60 |
| Daily Pivot Point S2 | 22.35 |
| Daily Pivot Point S3 | 22.14 |
| Daily Pivot Point R1 | 23.07 |
| Daily Pivot Point R2 | 23.28 |
| Daily Pivot Point R3 | 23.54 |
[/s2If]
Download Nehcap EAWe have two EAs that are operational on our LIVE accounts.
- EA-FIX: Check out the details here. Download EA-FIX . EA-FIX is a non-grid HFT scalper.
- EA-GROWTH: High quality low dd EA using trend grids. Download EA_GROWTHJoin Our Telegram Group


