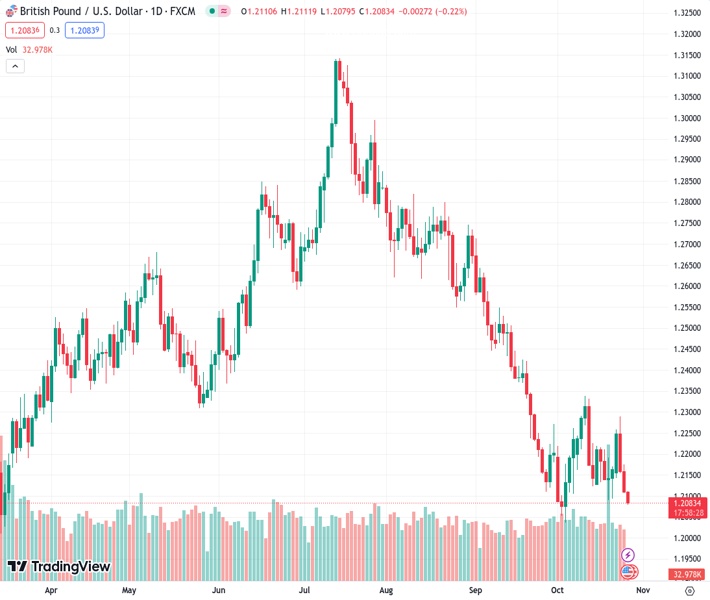
#GBPUSD @ 1.20826 drifts lower for the third successive day and drops to a multi-week low on Thursday.
…
This is a premium post.
[s2If !current_user_can(access_s2member_level4)]Please register for FREE REGISTER to read full post below containing analysis. In case of any error or you think you are not able to read the full post below, please email us at support#nehcap.com [lwa][/s2If] [s2If current_user_can(access_s2member_level1)]
- GBP/USD drifts lower for the third successive day and drops to a multi-week low on Thursday.
The pair currently trades last at 1.20826.
The previous day high was 1.2176 while the previous day low was 1.2106. The daily 38.2% Fib levels comes at 1.2133, expected to provide resistance. Similarly, the daily 61.8% fib level is at 1.215, expected to provide resistance.
The GBP/USD pair extends this week’s retracement slide from the vicinity of the 1.2300 mark and remains under some selling pressure for the third successive day on Thursday. The pair weakens further below the 1.2100 round figure, hitting over a three-week low during the Asian session, and is pressured by sustained US Dollar (USD) buying interest.
Growing acceptance that the Federal Reserve (Fed) will stick to its hawkish stance remains supportive of elevated US Treasury bond yields and continues to underpin the Greenback. In fact, the markets are still pricing in the possibility of one more Fed rate hike move by the end of this year. This allows the yield on the benchmark 10-year US government bond to hold steady close to a 16-year peak, around the 5% psychological mark touched earlier this week. Apart from this, a generally weaker risk tone turns out to be another factor benefitting the safe-haven buck, which, in turn, is seen exerting some pressure on the GBP/USD pair.
The British Pound (GBP), on the other hand, is weighed down by expectations that the Bank of England (BoE) will keep interest rates on hold at a 15-year high of 5.25% on November 2 on the back of looming recession risks. The bets were lifted by softer UK labour market data and flash PMI prints, which should allow the BoE to keep interest rates on hold. This contributes to the offered tone surrounding the GBP/USD pair and supports prospects for a further near-term depreciating move. In the absence of any relevant market-moving economic releases from the UK, traders now look to the US macro data for some meaningful impetus.
Thursday’s US economic docket highlights the release of the first estimate (Advance) of the US GDP print for Q3, along with Durable Goods Orders, due later during the early North American session. This, along with Fed Governor Christopher Waller’s scheduled speech and the US bond yields, should influence the USD. Apart from this, the post-ECB volatility in the market should produce short-term trading opportunities around the GBP/USD pair. Nevertheless, the aforementioned fundamental backdrop favours bearish traders and suggests that the path of least resistance for spot prices remains to the downside.
Technical Levels: Supports and Resistances
GBPUSD currently trading at 1.2087 at the time of writing. Pair opened at 1.2112 and is trading with a change of -0.21 % .
| Overview | Overview.1 | |
|---|---|---|
| 0 | Today last price | 1.2087 |
| 1 | Today Daily Change | -0.0025 |
| 2 | Today Daily Change % | -0.2100 |
| 3 | Today daily open | 1.2112 |
The pair remains strongly bearish on the daily time frame. It trades below the 20 SMA @ 1.2182, 50 SMA 1.2377, 100 SMA @ 1.2579 and 200 SMA @ 1.2442.
| Trends | Trends.1 | |
|---|---|---|
| 0 | Daily SMA20 | 1.2182 |
| 1 | Daily SMA50 | 1.2377 |
| 2 | Daily SMA100 | 1.2579 |
| 3 | Daily SMA200 | 1.2442 |
The previous day high was 1.2176 while the previous day low was 1.2106. The daily 38.2% Fib levels comes at 1.2133, expected to provide resistance. Similarly, the daily 61.8% fib level is at 1.215, expected to provide resistance.
Note the levels of interest below:
- Pivot support is noted at 1.2087, 1.2062, 1.2017
- Pivot resistance is noted at 1.2157, 1.2201, 1.2226
| Levels | Levels.1 |
|---|---|
| Previous Daily High | 1.2176 |
| Previous Daily Low | 1.2106 |
| Previous Weekly High | 1.2220 |
| Previous Weekly Low | 1.2090 |
| Previous Monthly High | 1.2713 |
| Previous Monthly Low | 1.2111 |
| Daily Fibonacci 38.2% | 1.2133 |
| Daily Fibonacci 61.8% | 1.2150 |
| Daily Pivot Point S1 | 1.2087 |
| Daily Pivot Point S2 | 1.2062 |
| Daily Pivot Point S3 | 1.2017 |
| Daily Pivot Point R1 | 1.2157 |
| Daily Pivot Point R2 | 1.2201 |
| Daily Pivot Point R3 | 1.2226 |
[/s2If]
Download Nehcap EAWe have two EAs that are operational on our LIVE accounts.
- EA-FIX: Check out the details here. Download EA-FIX . EA-FIX is a non-grid HFT scalper.
- EA-GROWTH: High quality low dd EA using trend grids. Download EA_GROWTHJoin Our Telegram Group


