#USDJPY @ 150.141 The has set a new 12-month high early Thursday, tipping over 150.30 as the Yen recedes further.
…
This is a premium post.
[s2If !current_user_can(access_s2member_level4)]Please register for FREE REGISTER to read full post below containing analysis. In case of any error or you think you are not able to read the full post below, please email us at support#nehcap.com [lwa][/s2If] [s2If current_user_can(access_s2member_level1)]
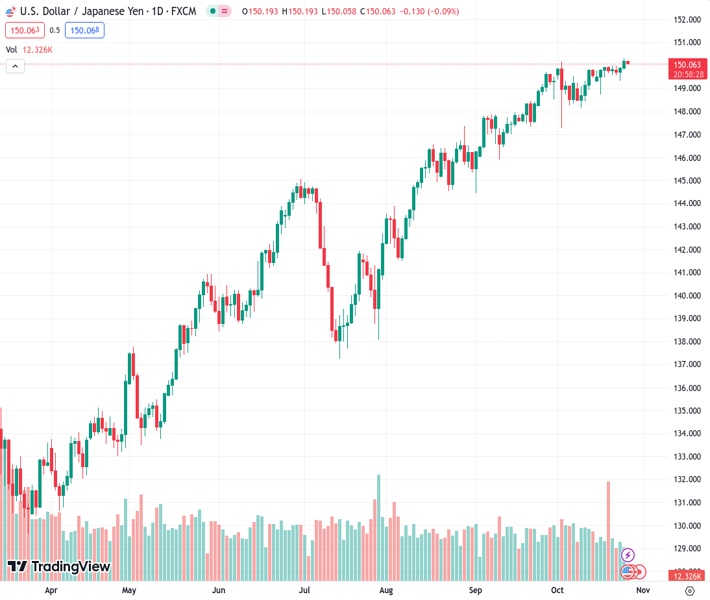
- The USD/JPY has set a new 12-month high early Thursday, tipping over 150.30 as the Yen recedes further.
The pair currently trades last at 150.141.
The previous day high was 149.94 while the previous day low was 149.32. The daily 38.2% Fib levels comes at 149.7, expected to provide support. Similarly, the daily 61.8% fib level is at 149.56, expected to provide support.
The USD/JPY ripped into a twelve-month high above 150.30 late Wednesday as markets continue to test the Bank of Japan’s (BoJ) resolve at defending the 150.00 handle, a level that has seen the BoJ draw a line in the sand on multiple occasions in the past.
The US Dollar continues to get a boost from broad-market risk aversion, coupled with rising US Treasury yields that continue to knock into 16-year highs. The 10-year T-note settled at 4.957% on Wednesday, a yield that the 10-year Treasury bond hasn’t seen since early 2007.
The Bank of Japan (BoJ) remains one of the only major central banks that hasn’t raised interest rates meaningfully over the last two years in a bid to stoke additional long-run inflation in Japan, but the Japanese central bank still fears that inflation pressures within Japan’s economy may undershoot their 2% target.
Wall Street investors are banking on a change in the BoJ’s strategies, possibly as soon as their next meeting, which could involve the BoJ abandoning their yield curve control mechanism, or their negative-rate short-term rate regime.
Friday’s Asia market session will see another round of Japanese inflation data, with the Tokyo Consumer Price Index (CPI) slated for 23:30 GMT Thursday.
The Core Tokyo CPI (headline inflation less volatile food prices) is expected to hold steady at 2.5% for the year into October, and investors will be keeping a close eye on the CPI inflation print to see if the BoJ will get punished into making policy adjustments soon.
The USD/JPY rallied into 150.32 late Wednesday, knocking into a new high for 2023 and knocking on the pair’s highest bids in twelve months.
Despite the Dollar-fueled pump, the pair is trading back below 150.20 heading into Thursday’s Asia trading session.
The USD/JPY is now trading into no-man’s-land, with little technical resistance above to mark in meaningful boundaries, but the pair’s long term bullish stance for the majority of 2023 sees little in the way of technical support outside of the 50-day Simple Moving Average (SMA) currently lifting into 148.00, while the 200-day SMA languishes near 140.00, far below current price action.
Technical Levels: Supports and Resistances
USDJPY currently trading at 150.17 at the time of writing. Pair opened at 149.92 and is trading with a change of 0.17 % .
| Overview | Overview.1 | |
|---|---|---|
| 0 | Today last price | 150.17 |
| 1 | Today Daily Change | 0.25 |
| 2 | Today Daily Change % | 0.17 |
| 3 | Today daily open | 149.92 |
The pair remains strongly bullish on the daily timeframe. It trades above its 20 SMA @ 149.42, 50 SMA 147.94, 100 SMA @ 144.94 and 200 SMA @ 139.56.
| Trends | Trends.1 | |
|---|---|---|
| 0 | Daily SMA20 | 149.42 |
| 1 | Daily SMA50 | 147.94 |
| 2 | Daily SMA100 | 144.94 |
| 3 | Daily SMA200 | 139.56 |
The previous day high was 149.94 while the previous day low was 149.32. The daily 38.2% Fib levels comes at 149.7, expected to provide support. Similarly, the daily 61.8% fib level is at 149.56, expected to provide support.
Note the levels of interest below:
- Pivot support is noted at 149.51, 149.11, 148.9
- Pivot resistance is noted at 150.13, 150.34, 150.74
| Levels | Levels.1 |
|---|---|
| Previous Daily High | 149.94 |
| Previous Daily Low | 149.32 |
| Previous Weekly High | 149.99 |
| Previous Weekly Low | 148.76 |
| Previous Monthly High | 149.71 |
| Previous Monthly Low | 144.44 |
| Daily Fibonacci 38.2% | 149.70 |
| Daily Fibonacci 61.8% | 149.56 |
| Daily Pivot Point S1 | 149.51 |
| Daily Pivot Point S2 | 149.11 |
| Daily Pivot Point S3 | 148.90 |
| Daily Pivot Point R1 | 150.13 |
| Daily Pivot Point R2 | 150.34 |
| Daily Pivot Point R3 | 150.74 |
[/s2If]
Download Nehcap EAWe have two EAs that are operational on our LIVE accounts.
- EA-FIX: Check out the details here. Download EA-FIX . EA-FIX is a non-grid HFT scalper.
- EA-GROWTH: High quality low dd EA using trend grids. Download EA_GROWTHJoin Our Telegram Group


