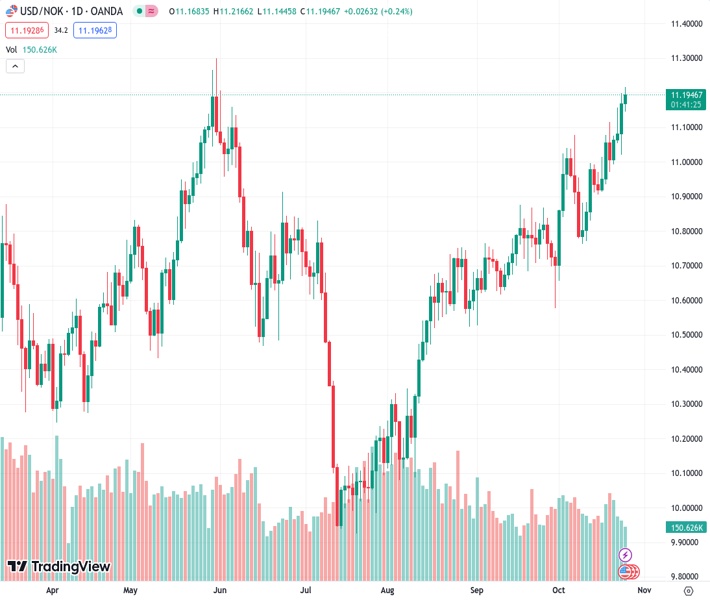
#USDNOK @ 11.19281 rose to a high of 11.215, its highest since late May and then settled at 11.191.
…
This is a premium post.
[s2If !current_user_can(access_s2member_level4)]Please register for FREE REGISTER to read full post below containing analysis. In case of any error or you think you are not able to read the full post below, please email us at support#nehcap.com [lwa][/s2If] [s2If current_user_can(access_s2member_level1)]
- USD/NOK rose to a high of 11.215, its highest since late May and then settled at 11.191.
The pair currently trades last at 11.19281.
The previous day high was 11.1985 while the previous day low was 11.0206. The daily 38.2% Fib levels comes at 11.1306, expected to provide support. Similarly, the daily 61.8% fib level is at 11.0886, expected to provide support.
On Wednesday, the USD/NOK jumped to a daily high of around 11.215, its highest since May 31, and since last Friday, the pair has increased by more than 1%. Higher US treasury yields and firm economic activity figures from its local economy benefit the US Dollar over the NOK.
In line with that, S&P Global Manufacturing and Services PMIs from the US came in better than expected on Tuesday while the Eurozone indexes disappointed, suggesting that in the current cycle of global financial tightening, the US economy seems to be the last man standing. In addition, the 2,5 and 10-year yields are trading in multi-year highs at 5.10%,4.91 and 4.95%, respectively. Nordea analyst pointed out that rising yields are weighing on equities, which made Norwegian pension managers need to reduce FX hedges by selling NOK. They also claimed that higher energy prices and geopolitical tensions also made the Norgewian currency struggle to find demand.
Focus now shifts to the European Central Bank (ECB) decision on Thursday, where markets are not discounting any rate hikes. Still, Christine Largarde’s press conference will be important for the economic outlook of the European continent. In the same session, the US will release Gross Domestic Product (GDP) preliminary estimates from Q3 and Personal Consumption Expenditures (PCE) figures from September on Friday.
With both Relative Strength Index (RSI) and Moving Average Convergence Divergence (MACD) comfortably placed in positive territory on the daily chart, the USD/NOK buyers hold the upperhand. However, both indicators approached overbought conditions which could fuel a technical correction in the upcoming session as the pair rose in the last four days.
Furthermore, the pair is above the 20,100,200-day Simple Moving Average (SMAs), suggesting that the bears are struggling to challenge the overall bullish trend.
Support levels: 11.095, 11.020, 10.945 (20-day SMA),
Resistance levels: 11.167, 11.215, 11.300.
Technical Levels: Supports and Resistances
USDNOK currently trading at 11.1877 at the time of writing. Pair opened at 11.1695 and is trading with a change of 0.16 % .
| Overview | Overview.1 | |
|---|---|---|
| 0 | Today last price | 11.1877 |
| 1 | Today Daily Change | 0.0182 |
| 2 | Today Daily Change % | 0.1600 |
| 3 | Today daily open | 11.1695 |
The pair remains strongly bullish on the daily timeframe. It trades above its 20 SMA @ 10.9236, 50 SMA 10.7863, 100 SMA @ 10.6124 and 200 SMA @ 10.5512.
| Trends | Trends.1 | |
|---|---|---|
| 0 | Daily SMA20 | 10.9236 |
| 1 | Daily SMA50 | 10.7863 |
| 2 | Daily SMA100 | 10.6124 |
| 3 | Daily SMA200 | 10.5512 |
The previous day high was 11.1985 while the previous day low was 11.0206. The daily 38.2% Fib levels comes at 11.1306, expected to provide support. Similarly, the daily 61.8% fib level is at 11.0886, expected to provide support.
Note the levels of interest below:
- Pivot support is noted at 11.0606, 10.9516, 10.8827
- Pivot resistance is noted at 11.2385, 11.3074, 11.4164
| Levels | Levels.1 |
|---|---|
| Previous Daily High | 11.1985 |
| Previous Daily Low | 11.0206 |
| Previous Weekly High | 11.1145 |
| Previous Weekly Low | 10.9048 |
| Previous Monthly High | 10.8758 |
| Previous Monthly Low | 10.5261 |
| Daily Fibonacci 38.2% | 11.1306 |
| Daily Fibonacci 61.8% | 11.0886 |
| Daily Pivot Point S1 | 11.0606 |
| Daily Pivot Point S2 | 10.9516 |
| Daily Pivot Point S3 | 10.8827 |
| Daily Pivot Point R1 | 11.2385 |
| Daily Pivot Point R2 | 11.3074 |
| Daily Pivot Point R3 | 11.4164 |
[/s2If]
Download Nehcap EAWe have two EAs that are operational on our LIVE accounts.
- EA-FIX: Check out the details here. Download EA-FIX . EA-FIX is a non-grid HFT scalper.
- EA-GROWTH: High quality low dd EA using trend grids. Download EA_GROWTHJoin Our Telegram Group


