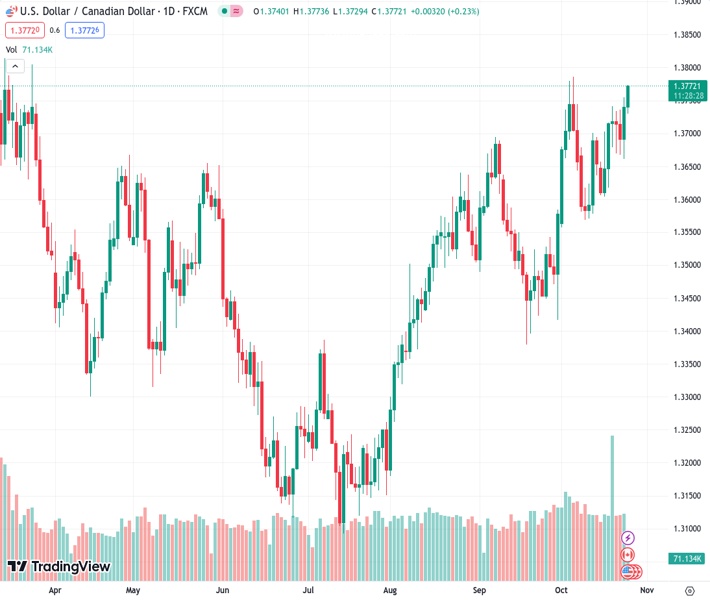
#USDCAD @ 1.37700 advances on lower oil prices, US Dollar’s recovery, and neutral BoC bets.
…
This is a premium post.
[s2If !current_user_can(access_s2member_level4)]Please register for FREE REGISTER to read full post below containing analysis. In case of any error or you think you are not able to read the full post below, please email us at support#nehcap.com [lwa][/s2If] [s2If current_user_can(access_s2member_level1)]
- USD/CAD advances on lower oil prices, US Dollar’s recovery, and neutral BoC bets.
The pair currently trades last at 1.37700.
The previous day high was 1.3755 while the previous day low was 1.3661. The daily 38.2% Fib levels comes at 1.3719, expected to provide support. Similarly, the daily 61.8% fib level is at 1.3697, expected to provide support.
The USD/CAD pair holds onto gains prompted by a breakout of the consolidation formed in a range of 1.3665-1.3740 in the European session. The Loonie asset capitalizes on expectations that the Bank of Canada (BoC) will keep interest rates unchanged at 5% for the second time in a row.
In addition to expectations of a BoC pause, a strong recovery in the US Dollar after an uptick in the US business activities has infused strength in the Loonie asset. The US Dollar recovered strongly on Tuesday after S&P Global reported higher Manufacturing and Services PMI in October amid robust consumer spending despite higher interest rates by the Federal Reserve (Fed).
The oil price corrected significantly as investors hoped that the Israel-Hamas war could be contained. Various nations urge Israel to rethink the consequences of ground assault in Gaza, which could result in a deep shock for the global economy. It is worth noting that Canada is the leading exporter of oil to the United States and lower oil prices impact the Canadian Dollar.
USD/CAD hovers near the upper portion of the Rising Channel chart pattern on an hourly scale in an attempt for a breakout. The Loonie asset is approaching the horizontal resistance plotted from October 5 high at 1.3784. Upward-sloping 50-period Exponential Moving Average (EMA) at 1.3720 warrants more upside ahead.
The Relative Strength Index (RSI) (14) shifts into the bullish range of 60.00-80.00, which indicates that the upside momentum has been triggered.
A decisive break above March 24 high around 1.3800 would expose the asset to March 10 high at 1.3860, followed by the round-level resistance at 1.3900.
In an alternate scenario, a breakdown below September 25 low around 1.3450 would drag the asset toward September 20 low near 1.3400. A further breakdown could expose the asset to six-week low near 1.3356.
Technical Levels: Supports and Resistances
USDCAD currently trading at 1.3769 at the time of writing. Pair opened at 1.374 and is trading with a change of 0.21 % .
| Overview | Overview.1 | |
|---|---|---|
| 0 | Today last price | 1.3769 |
| 1 | Today Daily Change | 0.0029 |
| 2 | Today Daily Change % | 0.2100 |
| 3 | Today daily open | 1.3740 |
The pair remains strongly bullish on the daily timeframe. It trades above its 20 SMA @ 1.3651, 50 SMA 1.3589, 100 SMA @ 1.343 and 200 SMA @ 1.3474.
| Trends | Trends.1 | |
|---|---|---|
| 0 | Daily SMA20 | 1.3651 |
| 1 | Daily SMA50 | 1.3589 |
| 2 | Daily SMA100 | 1.3430 |
| 3 | Daily SMA200 | 1.3474 |
The previous day high was 1.3755 while the previous day low was 1.3661. The daily 38.2% Fib levels comes at 1.3719, expected to provide support. Similarly, the daily 61.8% fib level is at 1.3697, expected to provide support.
Note the levels of interest below:
- Pivot support is noted at 1.3683, 1.3625, 1.3589
- Pivot resistance is noted at 1.3776, 1.3812, 1.387
| Levels | Levels.1 |
|---|---|
| Previous Daily High | 1.3755 |
| Previous Daily Low | 1.3661 |
| Previous Weekly High | 1.3741 |
| Previous Weekly Low | 1.3606 |
| Previous Monthly High | 1.3694 |
| Previous Monthly Low | 1.3379 |
| Daily Fibonacci 38.2% | 1.3719 |
| Daily Fibonacci 61.8% | 1.3697 |
| Daily Pivot Point S1 | 1.3683 |
| Daily Pivot Point S2 | 1.3625 |
| Daily Pivot Point S3 | 1.3589 |
| Daily Pivot Point R1 | 1.3776 |
| Daily Pivot Point R2 | 1.3812 |
| Daily Pivot Point R3 | 1.3870 |
[/s2If]
Download Nehcap EAWe have two EAs that are operational on our LIVE accounts.
- EA-FIX: Check out the details here. Download EA-FIX . EA-FIX is a non-grid HFT scalper.
- EA-GROWTH: High quality low dd EA using trend grids. Download EA_GROWTHJoin Our Telegram Group


