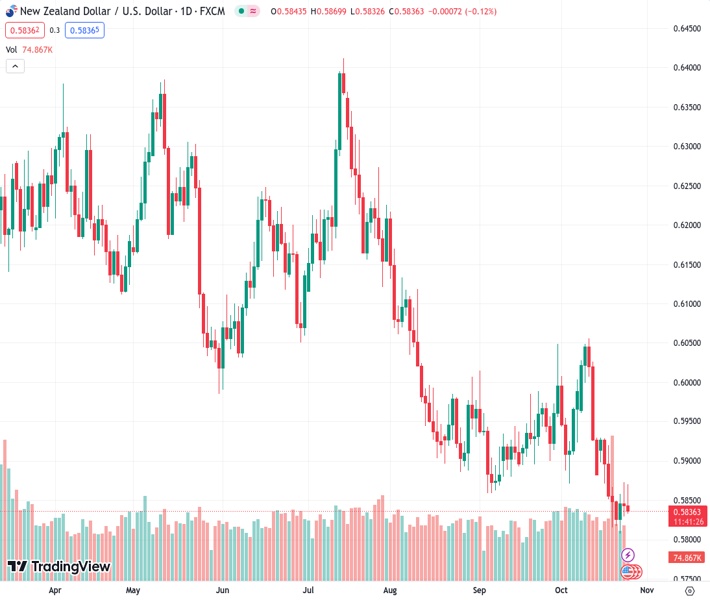
#NZDUSD @ 0.58380 looks to extend losses due to the stronger US Dollar.
…
This is a premium post.
[s2If !current_user_can(access_s2member_level4)]Please register for FREE REGISTER to read full post below containing analysis. In case of any error or you think you are not able to read the full post below, please email us at support#nehcap.com [lwa][/s2If] [s2If current_user_can(access_s2member_level1)]
- NZD/USD looks to extend losses due to the stronger US Dollar.
The pair currently trades last at 0.58380.
The previous day high was 0.5874 while the previous day low was 0.5828. The daily 38.2% Fib levels comes at 0.5846, expected to provide resistance. Similarly, the daily 61.8% fib level is at 0.5856, expected to provide resistance.
NZD/USD struggles to remain in the positive territory after minor losses registered in the previous session due to weaker upbeat S&P Global PMI from the United States (US).
US S&P Global Composite PMI showed growth in October, rising from 50.2 to 51.0. The Services PMI experienced an increase, reaching 50.9, while the Manufacturing PMI rose to 50.0. The manufacturing index has maintained a level above the 50-point threshold in the last six months, indicating a positive shift in that sector.
NZD/USD trades around the 0.5850 psychological level during the European session on Wednesday. The pair has almost trimmed its intraday gains as the US Dollar (USD) continues the gains for the second successive day.
The nine-day Exponential Moving Average (EMA) at 0.5870 appears to be the key barrier, followed by the 0.5900 psychological level.
A firm break above the latter could open the doors for the NZD/USD pair to explore the region around the 23.6% Fibonacci retracement at 0.5950.
On the downside, the region around the major level at 0.5800 aligned with the monthly low at 0.5807 could act again as the immediate support for the NZD/USD pair.
The Moving Average Convergence Divergence (MACD) line remains beneath both the centerline and the signal line. The financial sonnet echoes a bearish refrain for the NZD/USD pair.
Furthermore, the NZD/USD pair unveils a bearish momentum, as the 14-day Relative Strength Index (RSI) flaunts a palpable penchant for weakness, gracefully bowing beneath the 50 level.
Technical Levels: Supports and Resistances
NZDUSD currently trading at 0.5846 at the time of writing. Pair opened at 0.5844 and is trading with a change of 0.03 % .
| Overview | Overview.1 | |
|---|---|---|
| 0 | Today last price | 0.5846 |
| 1 | Today Daily Change | 0.0002 |
| 2 | Today Daily Change % | 0.0300 |
| 3 | Today daily open | 0.5844 |
The pair remains strongly bearish on the daily time frame. It trades below the 20 SMA @ 0.5927, 50 SMA 0.5927, 100 SMA @ 0.6044 and 200 SMA @ 0.6144.
| Trends | Trends.1 | |
|---|---|---|
| 0 | Daily SMA20 | 0.5927 |
| 1 | Daily SMA50 | 0.5927 |
| 2 | Daily SMA100 | 0.6044 |
| 3 | Daily SMA200 | 0.6144 |
The previous day high was 0.5874 while the previous day low was 0.5828. The daily 38.2% Fib levels comes at 0.5846, expected to provide resistance. Similarly, the daily 61.8% fib level is at 0.5856, expected to provide resistance.
Note the levels of interest below:
- Pivot support is noted at 0.5823, 0.5803, 0.5777
- Pivot resistance is noted at 0.5869, 0.5895, 0.5915
| Levels | Levels.1 |
|---|---|
| Previous Daily High | 0.5874 |
| Previous Daily Low | 0.5828 |
| Previous Weekly High | 0.5931 |
| Previous Weekly Low | 0.5815 |
| Previous Monthly High | 0.6050 |
| Previous Monthly Low | 0.5847 |
| Daily Fibonacci 38.2% | 0.5846 |
| Daily Fibonacci 61.8% | 0.5856 |
| Daily Pivot Point S1 | 0.5823 |
| Daily Pivot Point S2 | 0.5803 |
| Daily Pivot Point S3 | 0.5777 |
| Daily Pivot Point R1 | 0.5869 |
| Daily Pivot Point R2 | 0.5895 |
| Daily Pivot Point R3 | 0.5915 |
[/s2If]
Download Nehcap EAWe have two EAs that are operational on our LIVE accounts.
- EA-FIX: Check out the details here. Download EA-FIX . EA-FIX is a non-grid HFT scalper.
- EA-GROWTH: High quality low dd EA using trend grids. Download EA_GROWTHJoin Our Telegram Group


