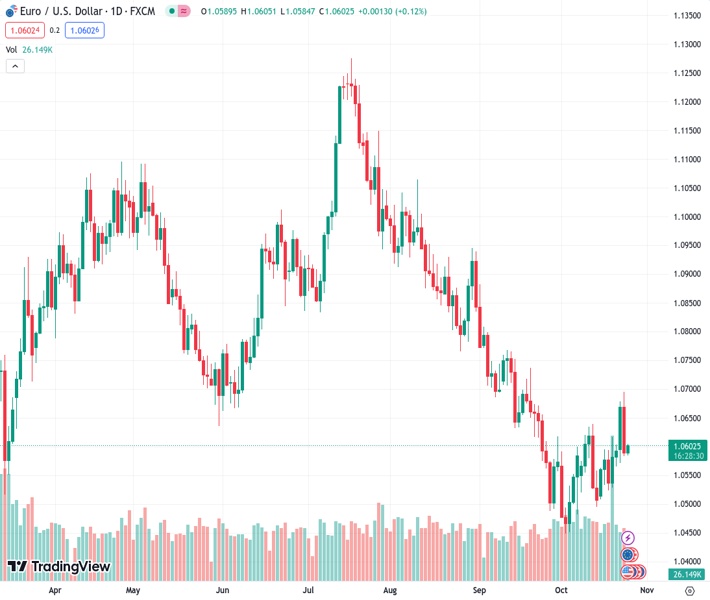
#EURUSD @ 1.06023 aims to retrace the recent losses despite adverse PMI data.
…
This is a premium post.
[s2If !current_user_can(access_s2member_level4)]Please register for FREE REGISTER to read full post below containing analysis. In case of any error or you think you are not able to read the full post below, please email us at support#nehcap.com [lwa][/s2If] [s2If current_user_can(access_s2member_level1)]
- EUR/USD aims to retrace the recent losses despite adverse PMI data.
The pair currently trades last at 1.06023.
The previous day high was 1.0695 while the previous day low was 1.0583. The daily 38.2% Fib levels comes at 1.0626, expected to provide resistance. Similarly, the daily 61.8% fib level is at 1.0652, expected to provide resistance.
EUR/USD attempts to regain the upward direction post losses registered in the previous session due to weaker Eurozone PMI and upbeat S&P Global PMI from the United States (US).
The preliminary HCOB Composite PMI for the eurozone declined to 46.5 in October, down from 47.2 in September. This marks the sixth consecutive reading below 50, indicating a persistent slowdown.
The Manufacturing PMI dropped to 43.0, compared to the previous reading of 43.4 and falling short of the expected 43.7. Additionally, the Services PMI decreased to 47.8 from the previous 48.7.
On the US side, the S&P Global Composite PMI showed growth in October, rising from 50.2 to 51.0. The Services PMI experienced an increase, reaching 50.9, while the Manufacturing PMI rose to 50.0. The manufacturing index has maintained a level above the 50-point threshold in the last six months, indicating a positive shift in that sector.
EUR/USD trades higher around the 1.0600 psychological level during the Asian session on Wednesday. The pair receives upward support on the decline in the US Dollar (USD), coupled with an improved risk sentiment and stable US Dollar post recent gains.
The 23.6% Fibonacci retracement at 1.0643 emerges as the key resistance followed by the monthly high at 1.0694, which is aligned with the major level at 1.0700.
A break above the latter could open the doors for the EUR/USD pair to explore the region around the 1.0750 psychological level.
On the downside, the EUR/USD pair could meet the support around the 14-day Exponential Moving Average (EMA) at 1.0586, followed by the 1.0550 psychological level.
The Moving Average Convergence Divergence (MACD) line positions below the centerline, indicating that the short-term average is below the long-term average. However, an intriguing development is emerging as the line diverges above the signal line, suggesting the possibility of a momentum shift towards a bullish trend.
On the other hand, the EUR/USD pair suggests a bearish momentum, with a discernible weaker bias highlighted in the 14-day Relative Strength Index (RSI), which is below the 50 level.
Technical Levels: Supports and Resistances
EURUSD currently trading at 1.0602 at the time of writing. Pair opened at 1.059 and is trading with a change of 0.11 % .
| Overview | Overview.1 | |
|---|---|---|
| 0 | Today last price | 1.0602 |
| 1 | Today Daily Change | 0.0012 |
| 2 | Today Daily Change % | 0.1100 |
| 3 | Today daily open | 1.0590 |
The pair is trading above its 20 Daily moving average @ 1.0558, below its 50 Daily moving average @ 1.0678 , below its 100 Daily moving average @ 1.0824 and below its 200 Daily moving average @ 1.0818
| Trends | Trends.1 | |
|---|---|---|
| 0 | Daily SMA20 | 1.0558 |
| 1 | Daily SMA50 | 1.0678 |
| 2 | Daily SMA100 | 1.0824 |
| 3 | Daily SMA200 | 1.0818 |
The previous day high was 1.0695 while the previous day low was 1.0583. The daily 38.2% Fib levels comes at 1.0626, expected to provide resistance. Similarly, the daily 61.8% fib level is at 1.0652, expected to provide resistance.
Note the levels of interest below:
- Pivot support is noted at 1.0551, 1.0511, 1.0439
- Pivot resistance is noted at 1.0662, 1.0734, 1.0774
| Levels | Levels.1 |
|---|---|
| Previous Daily High | 1.0695 |
| Previous Daily Low | 1.0583 |
| Previous Weekly High | 1.0617 |
| Previous Weekly Low | 1.0511 |
| Previous Monthly High | 1.0882 |
| Previous Monthly Low | 1.0488 |
| Daily Fibonacci 38.2% | 1.0626 |
| Daily Fibonacci 61.8% | 1.0652 |
| Daily Pivot Point S1 | 1.0551 |
| Daily Pivot Point S2 | 1.0511 |
| Daily Pivot Point S3 | 1.0439 |
| Daily Pivot Point R1 | 1.0662 |
| Daily Pivot Point R2 | 1.0734 |
| Daily Pivot Point R3 | 1.0774 |
[/s2If]
Download Nehcap EAWe have two EAs that are operational on our LIVE accounts.
- EA-FIX: Check out the details here. Download EA-FIX . EA-FIX is a non-grid HFT scalper.
- EA-GROWTH: High quality low dd EA using trend grids. Download EA_GROWTHJoin Our Telegram Group


