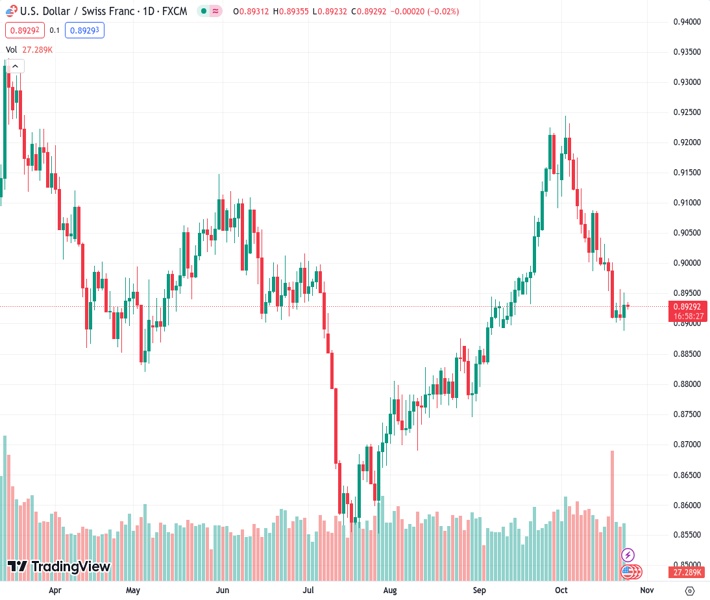
#USDCHF @ 0.89289 trades in negative territory around 0.8928, despite the upbeat US data.
…
This is a premium post.
[s2If !current_user_can(access_s2member_level4)]Please register for FREE REGISTER to read full post below containing analysis. In case of any error or you think you are not able to read the full post below, please email us at support#nehcap.com [lwa][/s2If] [s2If current_user_can(access_s2member_level1)]
- USD/CHF trades in negative territory around 0.8928, despite the upbeat US data.
The pair currently trades last at 0.89289.
The previous day high was 0.8954 while the previous day low was 0.8888. The daily 38.2% Fib levels comes at 0.8929, expected to provide resistance. Similarly, the daily 61.8% fib level is at 0.8913, expected to provide support.
The USD/CHF pair loses traction during the Asian trading hours on Wednesday. That being said, the geopolitical conflicts in the Middle East continue to hang over the market and benefit Swiss France (CHF). The pair currently trades near 0.8928, down 0.05% on the day.
The US Purchasing Management Index (PMI) data on Tuesday came in better than expected. The flash Composite PMI for October climbed to 51.0 from 50.2. Meanwhile, the US S&P Global Manufacturing PMI for October surged to 50, better than the market expectation of 49.5. This is the first time in six months that manufacturing has not fallen below 50. The Services PMI rose to 50.9, above the consensus. The Services PMI rose to 50.9, while Manufacturing PMI grew to 50.0. This is the first time in six months that manufacturing has not fallen below 50.
Additionally, the Richmond Manufacturing Index for October fell to 3 from 5 in the previous reading, below the market expectation. The upbeat US economic data alleviated fears that tighter monetary policy and higher borrowing rates would dampen investment and industrial activity. However, traders will take cues from the US growth numbers and core Personal Consumption Expenditure Index (PCE) data for fresh impetus. The stronger-than-expected data could lift the Greenback and act as a tailwind for the USD/CHF pair.
On the other hand, the rising tension in the Middle East might cap the upside of the pair and boost the safe-haven assets like Swiss France. Last week, the Swiss Trade surplus widened more than expected in September. Trade Balance arrived at 6,316M versus 3,814M seen in the previous month, above the market consensus of 3,770M. Meanwhile, Exports surged to 24,795M MoM in September from the previous reading of 20,932M whereas Imports came in at 18,480M MoM versus 17,118M prior.
Market players will monitor the Swiss ZEW Survey Expectations for October. Later this week, the preliminary estimate of the US Q3 Gross Domestic Product (GDP) will be due on Thursday, and the US Core Personal Consumption Expenditure Index (PCE) will be due on Friday. These events could give a clear direction to the USD/CHF pair.
Technical Levels: Supports and Resistances
USDCHF currently trading at 0.8929 at the time of writing. Pair opened at 0.8932 and is trading with a change of -0.03 % .
| Overview | Overview.1 | |
|---|---|---|
| 0 | Today last price | 0.8929 |
| 1 | Today Daily Change | -0.0003 |
| 2 | Today Daily Change % | -0.0300 |
| 3 | Today daily open | 0.8932 |
The pair is trading below its 20 Daily moving average @ 0.906, below its 50 Daily moving average @ 0.8966 , above its 100 Daily moving average @ 0.8898 and below its 200 Daily moving average @ 0.9011
| Trends | Trends.1 | |
|---|---|---|
| 0 | Daily SMA20 | 0.9060 |
| 1 | Daily SMA50 | 0.8966 |
| 2 | Daily SMA100 | 0.8898 |
| 3 | Daily SMA200 | 0.9011 |
The previous day high was 0.8954 while the previous day low was 0.8888. The daily 38.2% Fib levels comes at 0.8929, expected to provide resistance. Similarly, the daily 61.8% fib level is at 0.8913, expected to provide support.
Note the levels of interest below:
- Pivot support is noted at 0.8896, 0.8859, 0.883
- Pivot resistance is noted at 0.8961, 0.899, 0.9027
| Levels | Levels.1 |
|---|---|
| Previous Daily High | 0.8954 |
| Previous Daily Low | 0.8888 |
| Previous Weekly High | 0.9042 |
| Previous Weekly Low | 0.8902 |
| Previous Monthly High | 0.9225 |
| Previous Monthly Low | 0.8795 |
| Daily Fibonacci 38.2% | 0.8929 |
| Daily Fibonacci 61.8% | 0.8913 |
| Daily Pivot Point S1 | 0.8896 |
| Daily Pivot Point S2 | 0.8859 |
| Daily Pivot Point S3 | 0.8830 |
| Daily Pivot Point R1 | 0.8961 |
| Daily Pivot Point R2 | 0.8990 |
| Daily Pivot Point R3 | 0.9027 |
[/s2If]
Download Nehcap EAWe have two EAs that are operational on our LIVE accounts.
- EA-FIX: Check out the details here. Download EA-FIX . EA-FIX is a non-grid HFT scalper.
- EA-GROWTH: High quality low dd EA using trend grids. Download EA_GROWTHJoin Our Telegram Group


