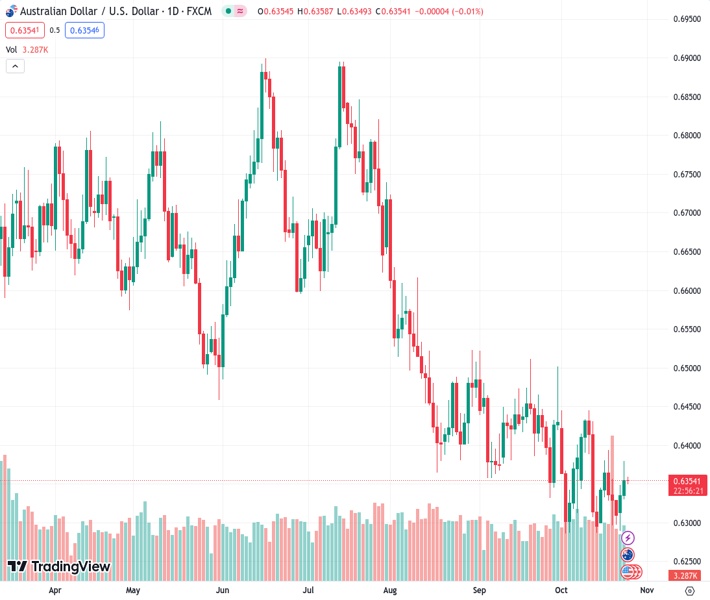
#AUDUSD @ 0.63544 The saw a slight gain on Tuesday, tapping 0.6379 before settling at the halfway point near 0.6350.
…
This is a premium post.
[s2If !current_user_can(access_s2member_level4)]Please register for FREE REGISTER to read full post below containing analysis. In case of any error or you think you are not able to read the full post below, please email us at support#nehcap.com [lwa][/s2If] [s2If current_user_can(access_s2member_level1)]
- The AUD/USD saw a slight gain on Tuesday, tapping 0.6379 before settling at the halfway point near 0.6350.
The pair currently trades last at 0.63544.
The previous day high was 0.6349 while the previous day low was 0.6289. The daily 38.2% Fib levels comes at 0.6326, expected to provide support. Similarly, the daily 61.8% fib level is at 0.6312, expected to provide support.
The AUD/USD saw an early climb on Tuesday after hawkish comments from Reserve Bank of Australia (RBA) Governor Michelle Bullock propped up the Aussie (AUD) ahead of Wednesday’s Australian Consumer Price Index (CPI) inflation data due early in the Asia market session, while policy watchers will also be keeping an eye out for RBA Governor Bullock’s statements on the state of the Australian economy when she testifies before the Senate Economics Legislative Committee in Canberra early Thursday.
Australia CPI Preview: Inflation data could challenge RBA tolerance
The AUD/USD climbed from Tuesday’s opening bids of 0.6336 to tap into an intraday high of 0.6379 before settling back to the halfway mark near 0.6350, and Aussie investors are now gearing up for an early reading of the Aussie CPI release.
As Australia’s domestic economy continues to struggle with sticky inflation that refuses to drop into the RBA’s desired levels, an acceleration of Aussie inflation data could see the RBA pushed one step closer to making additional rate hikes.
AUD will receive additional upside momentum if inflation eases less quickly than expected – Commerzbank
Australia’s Monthly Consumer Price Index for the annualized period into September is forecast to chalk in a slight uptick to 5.4% against August’s print of 5.2%, while the quarterly CPI figure is expected to likewise step up from 0.8% to 1.1% for the third quarter.
The RBA’s Trimmed Mean CPI indicator for the year into September, meanwhile, is expected to show an adjusted decline from 5.9% to 5.0%, and investors will be watching this number closely to get a bead on where the RBA will be looking before making any decision on policy adjustments.
The AUD/USD has been drifting back down steadily after pinging a fresh intraday high, but still remains capped by last week’s peak just north of 0.6390, and Aussie bulls will be waiting for a spark from the Australian CPI headliner before making another drive into the topside.
On the low end, technical support is building out a price floor from the 50- and 200-hour Simple Moving Averages (SMAs) after a bullish cross on the charts just above 0.6330, and a drop into the chart territory could see an extended rebound higher, while a bearish breakdown will see the Aussie set for a renewed challenge of Monday’s swing low into 0.62190.
Technical Levels: Supports and Resistances
AUDUSD currently trading at 0.6356 at the time of writing. Pair opened at 0.6336 and is trading with a change of 0.32 % .
| Overview | Overview.1 | |
|---|---|---|
| 0 | Today last price | 0.6356 |
| 1 | Today Daily Change | 0.0020 |
| 2 | Today Daily Change % | 0.3200 |
| 3 | Today daily open | 0.6336 |
The pair remains strongly bearish on the daily time frame. It trades below the 20 SMA @ 0.6362, 50 SMA 0.6403, 100 SMA @ 0.655 and 200 SMA @ 0.6651.
| Trends | Trends.1 | |
|---|---|---|
| 0 | Daily SMA20 | 0.6362 |
| 1 | Daily SMA50 | 0.6403 |
| 2 | Daily SMA100 | 0.6550 |
| 3 | Daily SMA200 | 0.6651 |
The previous day high was 0.6349 while the previous day low was 0.6289. The daily 38.2% Fib levels comes at 0.6326, expected to provide support. Similarly, the daily 61.8% fib level is at 0.6312, expected to provide support.
Note the levels of interest below:
- Pivot support is noted at 0.63, 0.6265, 0.624
- Pivot resistance is noted at 0.636, 0.6384, 0.642
| Levels | Levels.1 |
|---|---|
| Previous Daily High | 0.6349 |
| Previous Daily Low | 0.6289 |
| Previous Weekly High | 0.6393 |
| Previous Weekly Low | 0.6296 |
| Previous Monthly High | 0.6522 |
| Previous Monthly Low | 0.6332 |
| Daily Fibonacci 38.2% | 0.6326 |
| Daily Fibonacci 61.8% | 0.6312 |
| Daily Pivot Point S1 | 0.6300 |
| Daily Pivot Point S2 | 0.6265 |
| Daily Pivot Point S3 | 0.6240 |
| Daily Pivot Point R1 | 0.6360 |
| Daily Pivot Point R2 | 0.6384 |
| Daily Pivot Point R3 | 0.6420 |
[/s2If]
Download Nehcap EAWe have two EAs that are operational on our LIVE accounts.
- EA-FIX: Check out the details here. Download EA-FIX . EA-FIX is a non-grid HFT scalper.
- EA-GROWTH: High quality low dd EA using trend grids. Download EA_GROWTHJoin Our Telegram Group
")


