#EURJPY @ 158.784 retreats from weekly high on gloomy Eurozone economic data.
…
This is a premium post.
[s2If !current_user_can(access_s2member_level4)]Please register for FREE REGISTER to read full post below containing analysis. In case of any error or you think you are not able to read the full post below, please email us at support#nehcap.com [lwa][/s2If] [s2If current_user_can(access_s2member_level1)]
- EUR/JPY retreats from weekly high on gloomy Eurozone economic data.
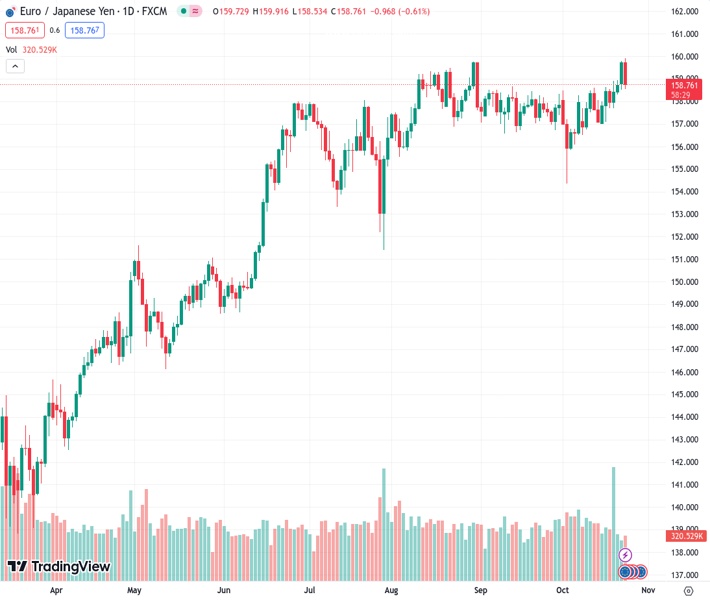
The pair currently trades last at 158.784.
The previous day high was 159.81 while the previous day low was 158.51. The daily 38.2% Fib levels comes at 159.31, expected to provide resistance. Similarly, the daily 61.8% fib level is at 159.0, expected to provide resistance.
EUR/JPY retreats from the weekly high hit on Tuesday at around 159.91 after economic data from the Eurozone (EU) painted a gloomy outlook for the whole economy in the bloc. Hence, as a bearish-engulfing candle pattern emerges, the cross-pair drops 0.64% and trades at 158.81, below the 159.00 figure.
Despite registering solid losses, the EUR/JPY remains upward biased, but risks of intervention would likely cap the pair at around 160.00. If that level is cleared, the cross could aim toward August’s 2008 high at 169.47 but, firstly, would need to crack the 165.00 figure on its way to the former.
Conversely, If EUR/JPY drops below the Tenkan-Sen level at 158.45, the pair could aim toward the top of the Ichimoku cloud at 157.90/158.00. Up next, a drop inside the Kumo, and sellers can drag the spot prices towards the Kijun-Sen at 157.13.
Technical Levels: Supports and Resistances
EURJPY currently trading at 158.75 at the time of writing. Pair opened at 159.77 and is trading with a change of -0.64 % .
| Overview | Overview.1 | |
|---|---|---|
| 0 | Today last price | 158.75 |
| 1 | Today Daily Change | -1.02 |
| 2 | Today Daily Change % | -0.64 |
| 3 | Today daily open | 159.77 |
The pair remains strongly bullish on the daily timeframe. It trades above its 20 SMA @ 157.7, 50 SMA 157.96, 100 SMA @ 156.73 and 200 SMA @ 150.84.
| Trends | Trends.1 | |
|---|---|---|
| 0 | Daily SMA20 | 157.70 |
| 1 | Daily SMA50 | 157.96 |
| 2 | Daily SMA100 | 156.73 |
| 3 | Daily SMA200 | 150.84 |
The previous day high was 159.81 while the previous day low was 158.51. The daily 38.2% Fib levels comes at 159.31, expected to provide resistance. Similarly, the daily 61.8% fib level is at 159.0, expected to provide resistance.
Note the levels of interest below:
- Pivot support is noted at 158.92, 158.06, 157.62
- Pivot resistance is noted at 160.22, 160.67, 161.52
| Levels | Levels.1 |
|---|---|
| Previous Daily High | 159.81 |
| Previous Daily Low | 158.51 |
| Previous Weekly High | 158.93 |
| Previous Weekly Low | 157.06 |
| Previous Monthly High | 158.66 |
| Previous Monthly Low | 156.58 |
| Daily Fibonacci 38.2% | 159.31 |
| Daily Fibonacci 61.8% | 159.00 |
| Daily Pivot Point S1 | 158.92 |
| Daily Pivot Point S2 | 158.06 |
| Daily Pivot Point S3 | 157.62 |
| Daily Pivot Point R1 | 160.22 |
| Daily Pivot Point R2 | 160.67 |
| Daily Pivot Point R3 | 161.52 |
[/s2If]
Download Nehcap EAWe have two EAs that are operational on our LIVE accounts.
- EA-FIX: Check out the details here. Download EA-FIX . EA-FIX is a non-grid HFT scalper.
- EA-GROWTH: High quality low dd EA using trend grids. Download EA_GROWTHJoin Our Telegram Group
")


