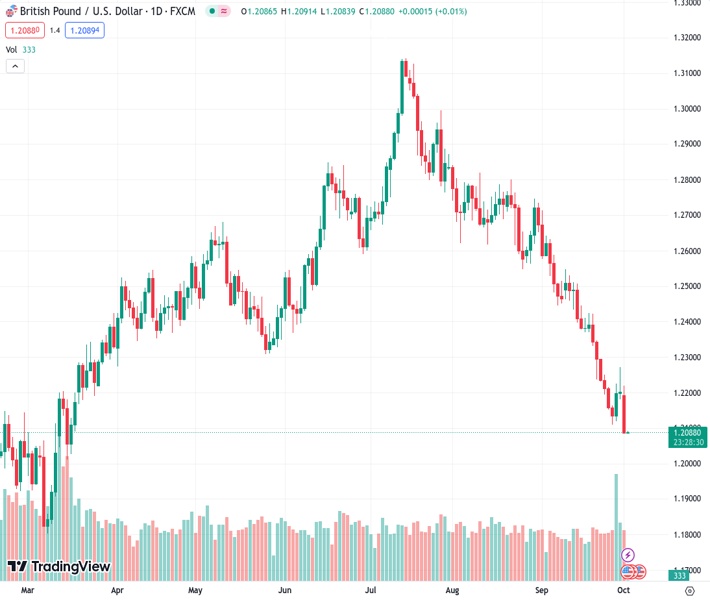
#GBPUSD @ 1.20882 tanks over 100 pips, reaching around 1.2080s, as the US Dollar Index advances to a 10-month high, and US bond yields rise.
…
This is a premium post.
[s2If !current_user_can(access_s2member_level4)]Please register for FREE REGISTER to read full post below containing analysis. In case of any error or you think you are not able to read the full post below, please email us at support#nehcap.com [lwa][/s2If] [s2If current_user_can(access_s2member_level1)]
- GBP/USD tanks over 100 pips, reaching around 1.2080s, as the US Dollar Index advances to a 10-month high, and US bond yields rise.
The pair currently trades last at 1.20882.
The previous day high was 1.2272 while the previous day low was 1.218. The daily 38.2% Fib levels comes at 1.2215, expected to provide resistance. Similarly, the daily 61.8% fib level is at 1.2237, expected to provide resistance.
The British Pound (GBP) tanks more than 100 pips versus the US Dollar (USD), after hitting a daily high of 1.2219. Nevertheless, offers at around 1.2200 sent the GBP/USD plummeting to a new eight-month low at around the 1.2080s area.
Sentiment slightly improved towards Wall Street’s close, though it failed to halt the Pound Sterling slide. The US Dollar Index, a gauge of the buck’s value vs. a basket of six currencies, advances to 107.00 up almost 0.80%, and hits a 10-month high. Consequently, US bond yields advanced.
Over the weekend, news in the United States (US) improved market sentiment as the US Congress passed a bill to fund the government, avoiding a shutdown. However, investors bracing for high interest rates, triggered a risk-off impulse in early trading in New York.
US economic data witnessed the ISM Manufacturing PMI in September, jumped from 47.9 to 49.8, at contractionary territory for the tenth straight month. Meanwhile, the Federal Reserve’s Vice Chair for Supervision Michael Barr echoed comments from Governor Bowmann that rates need to remain higher, but the latter opted for supporting another hike.
On the UK front, data revealed that manufacturing activity continued to slow sharply in September, though improved from 43.0 to 44.3 but remained in contractionary territory. Earlier, house prices in the UK were 5.3% lower than a year earlier.
Given the backdrop, the GBP/USD extended its losses, and investors eye the 1.2000 figure. A drop beneath that level, and the 1.1800 figure is on the cards.
The daily chart remains downward biased, as sellers eye the 1.2010 March 15 daily low, which could pave the way for further losses once cleared. A breach of that level, the GBP/USD would drift towards the next cycle low at 1.1802, the March 8 low. Conversely, if the major reclaims 1.2100. that could open the door for a pullback toward 1.2200 before the downtrend continues.
Technical Levels: Supports and Resistances
GBPUSD currently trading at 1.2088 at the time of writing. Pair opened at 1.2199 and is trading with a change of -0.91 % .
| Overview | Overview.1 | |
|---|---|---|
| 0 | Today last price | 1.2088 |
| 1 | Today Daily Change | -0.0111 |
| 2 | Today Daily Change % | -0.9100 |
| 3 | Today daily open | 1.2199 |
The pair remains strongly bearish on the daily time frame. It trades below the 20 SMA @ 1.2374, 50 SMA 1.2589, 100 SMA @ 1.2624 and 200 SMA @ 1.2436.
| Trends | Trends.1 | |
|---|---|---|
| 0 | Daily SMA20 | 1.2374 |
| 1 | Daily SMA50 | 1.2589 |
| 2 | Daily SMA100 | 1.2624 |
| 3 | Daily SMA200 | 1.2436 |
The previous day high was 1.2272 while the previous day low was 1.218. The daily 38.2% Fib levels comes at 1.2215, expected to provide resistance. Similarly, the daily 61.8% fib level is at 1.2237, expected to provide resistance.
Note the levels of interest below:
- Pivot support is noted at 1.2162, 1.2126, 1.2071
- Pivot resistance is noted at 1.2254, 1.2309, 1.2346
| Levels | Levels.1 |
|---|---|
| Previous Daily High | 1.2272 |
| Previous Daily Low | 1.2180 |
| Previous Weekly High | 1.2272 |
| Previous Weekly Low | 1.2111 |
| Previous Monthly High | 1.2713 |
| Previous Monthly Low | 1.2111 |
| Daily Fibonacci 38.2% | 1.2215 |
| Daily Fibonacci 61.8% | 1.2237 |
| Daily Pivot Point S1 | 1.2162 |
| Daily Pivot Point S2 | 1.2126 |
| Daily Pivot Point S3 | 1.2071 |
| Daily Pivot Point R1 | 1.2254 |
| Daily Pivot Point R2 | 1.2309 |
| Daily Pivot Point R3 | 1.2346 |
[/s2If]
Download Nehcap EAWe have two EAs that are operational on our LIVE accounts.
- EA-FIX: Check out the details here. Download EA-FIX . EA-FIX is a non-grid HFT scalper.
- EA-GROWTH: High quality low dd EA using trend grids. Download EA_GROWTHJoin Our Telegram Group
")


